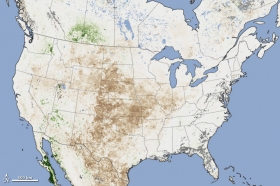
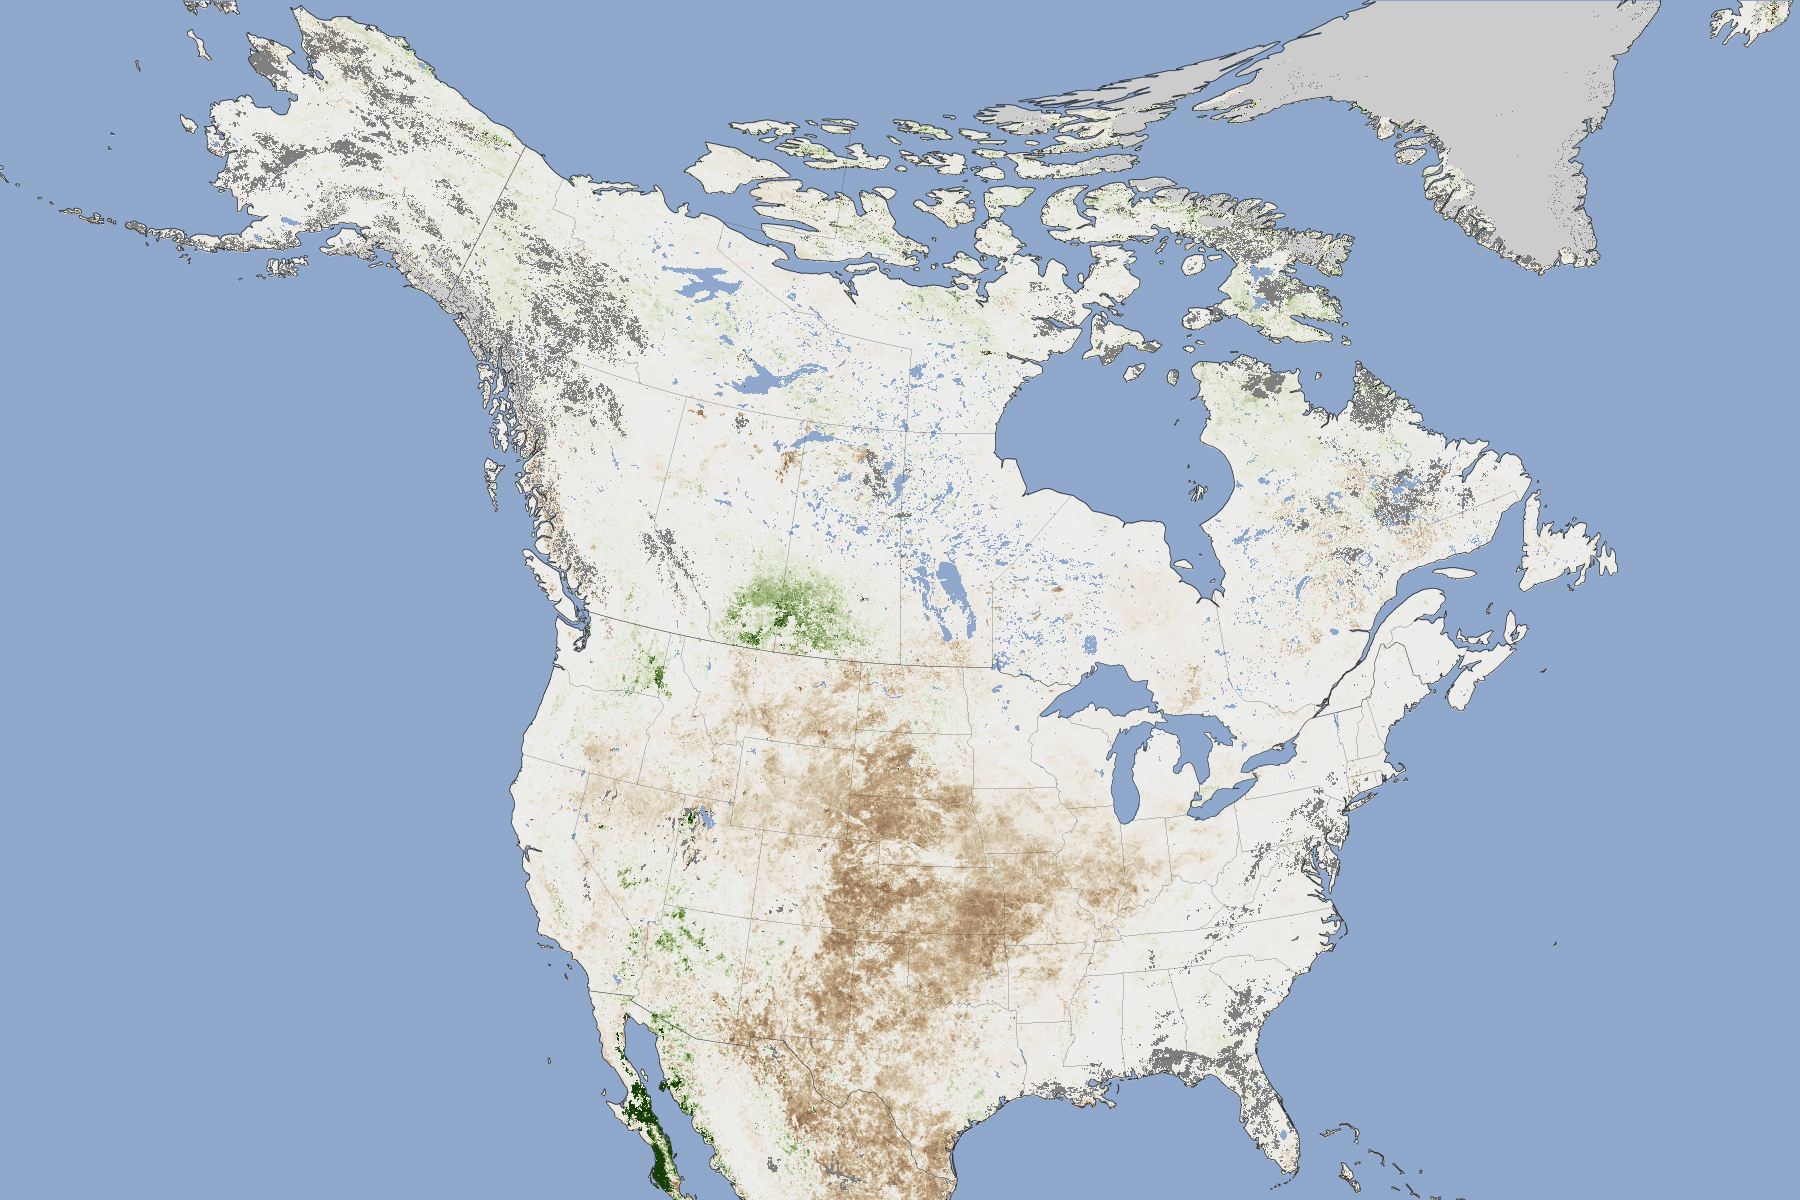
Nearly two thirds of the contiguous United States was experiencing some level of drought by the end of August 2012, according to the U.S. Drought Monitor. 39 percent of the nation suffered from severe to extreme drought. Though the numbers changed a bit in mid-September, the drought parched much of the interior United States and left both domestic and wild animals scrounging for food. There were also plenty of spectacular wild fires. The browning and withering of vegetation in the United States and northern Mexico is clear in the vegetation anomaly map based from NASA (Moderate Resolution Imaging Spectroradiometer (MODIS) on NASA’s Terra and Aqua satellites). The map contrasts plant health in August 2012 (the most recent full month available) against the average conditions between 2002 and 2012. Brown areas show where plant growth, or greenness, was below normal; greens indicate vegetation that is more widespread or abundant than normal for the time of year. Grays depict areas where data was not available.
Nearly two thirds of the contiguous United States was experiencing some level of drought by the end of August 2012, according to the U.S. Drought Monitor. 39 percent of the nation suffered from severe to extreme drought. Though the numbers changed a bit in mid-September, the drought parched much of the interior United States and left both domestic and wild animals scrounging for food. There were also plenty of spectacular wild fires. The browning and withering of vegetation in the United States and northern Mexico is clear in the vegetation anomaly map based from NASA (Moderate Resolution Imaging Spectroradiometer (MODIS) on NASA’s Terra and Aqua satellites). The map contrasts plant health in August 2012 (the most recent full month available) against the average conditions between 2002 and 2012. Brown areas show where plant growth, or greenness, was below normal; greens indicate vegetation that is more widespread or abundant than normal for the time of year. Grays depict areas where data was not available.
!ADVERTISEMENT!
The map is based on the Normalized Difference Vegetation Index (NDVI), a measure of how plant leaves absorb visible light and reflect infrared light. Drought-stressed vegetation reflects more visible light and less infrared than healthy vegetation.
"By far, this is the driest year we have seen since the launch of MODIS," said Molly Brown, a vegetation and food security researcher at NASA’s Goddard Space Flight Center. "I am struck by the extraordinary depth and spatial scale of this drought. There is very little fodder out there for animals to eat." Farmers and ranchers across the country are expecting losses, and nearly two dozen states have been made eligible for drought aid.
"The vegetation index helps us see how much or how little live plant material is out there," said Brown. Regardless of how much rainfall an area gets or needs in a certain time period—and regardless of whether it is a forest, plains, mountain, or desert ecosystem—NDVI allows researchers to compare how green the landscape is with how green it has been in previous years. It allows researchers to see how the landscape is being affected by the scarcity of water or by other environmental stresses.
In August 2012, the NDVI was strongly negative from the Rocky Mountains, across the Great Plains to the Mississippi and Ohio River valleys. Much of northern Mexico appeared to be drought-stricken as well. A few patches of above-normal growth appear in Canada’s Alberta and Saskatchewan provinces;, in Arizona and Nevada; and along the shores of the Gulf of California in Mexico.
The 2012 drought is the worst observed since the U.S. Drought Monitor began operating in 2000. The 2012 North American Drought is a record-breaking expansion of the 2010–2012 Southern United States drought which began in the spring of 2012, when the record-shattering lack of snow in the United States caused very little melt water to absorb into the soil. The drought includes most of the US, parts of Mexico, and central and Eastern Canada. It currently covers 80% of the contiguous United States with at least abnormally dry conditions. Out of that 80%, 62% is designated as at least moderate drought (D1) conditions. It is affecting a similarly large area as droughts in the 1930s and 1950s but it has not yet been in place as long.
For further information see Drought.
Map image via NASA.


