An unusually hot melting season in 2010 accelerated ice loss in southern Greenland by 100 billion tons – and large portions of the island’s bedrock rose an additional quarter of an inch in response. That’s the finding from a network of nearly 50 GPS stations planted along the Greenland coast to measure the bedrock’s natural response to the ever-diminishing weight of ice above it. The Greenland ice sheet is a vast body of ice covering 660,235 square miles, roughly 80% of the surface of Greenland. It is the second largest ice body in the world, after the Antarctic Ice Sheet. The ice sheet is almost 1,500 miles long in a north-south direction, and its greatest width is 680 miles at a latitude of 77°N, near its northern margin. The mean altitude of the ice is 7,005 feet.
An unusually hot melting season in 2010 accelerated ice loss in southern Greenland by 100 billion tons – and large portions of the island’s bedrock rose an additional quarter of an inch in response. That’s the finding from a network of nearly 50 GPS stations planted along the Greenland coast to measure the bedrock’s natural response to the ever-diminishing weight of ice above it. The Greenland ice sheet is a vast body of ice covering 660,235 square miles, roughly 80% of the surface of Greenland. It is the second largest ice body in the world, after the Antarctic Ice Sheet. The ice sheet is almost 1,500 miles long in a north-south direction, and its greatest width is 680 miles at a latitude of 77°N, near its northern margin. The mean altitude of the ice is 7,005 feet.
!ADVERTISEMENT!
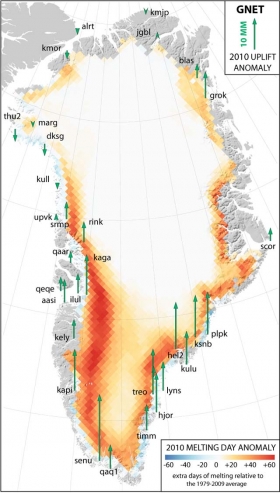
Every year as the Greenland Ice Sheet melts, the rocky coast rises, explained Michael Bevis, Ohio Eminent Scholar in Geodynamics and professor in the School of Earth Sciences at Ohio State University. Some GPS stations around Greenland routinely detect uplift of 15 mm (0.59 inches) or more, year after year. But a temperature spike in 2010 lifted the bedrock a detectably higher amount over a short five-month period – as high as 20 mm (0.79 inches) in some locations.
“Pulses of extra melting and uplift imply that we’ll experience pulses of extra sea level rise,†he said. "The process is not really a steady process."
Because the solid earth is elastic, Bevis and his team can use the natural flexing of the Greenland bedrock to measure the weight of the ice sheet, just like the compression of a spring in a bathroom scale measures the weight of the person standing on it.
Bevis is the principal investigator for the Greenland GPS Network (GNET), and he’s confident that the anomalous 2010 uplift that GNET detected is due to anomalous ice loss during 2010: "Really, there is no other explanation. The uplift anomaly correlates with maps of the 2010 melting day anomaly. In locations where there were many extra days of melting in 2010, the uplift anomaly is highest." In scientific parlance, a melting day anomaly refers to the number of extra melting days – that is, days that were warm enough to melt ice – relative to the average number of melting days per year over several decades.
In 2010, the southern half of Greenland lost an extra 100 billion tons of ice under conditions that scientists would consider anomalously warm.
GNET measurements indicate that as that ice melted away, the bedrock beneath it rose. The amount of uplift differed from station to station, depending on how close the station was to regions where ice loss was greatest.
Southern Greenland stations that were very close to zones of heavy ice loss rose as much as 20 mm (about 0.79 inches) over the five months. Even stations that were located far away typically rose at least 5 mm (0.2 inches) during the course of the 2010 melting season. But stations in the North of Greenland barely moved at all.
There have been several recent major Greenland ice loss events:
A major ice loss to northern Greenland's Petermann glacier occurred when the glacier lost 33 square miles (85 of floating ice between 2000 and 2001.
Between 2001 and 2005, a breakup of Sermeq Kujalleq erased 36 square miles from the ice field and raised awareness worldwide of glacial response to global climate change.
In July 2008, researchers monitoring daily satellite images discovered that a 11-square-mile piece of Petermann broke away.
For further information and photo: http://researchnews.osu.edu/archive/greenlift.htm


