New maps of the sub-ice features in Antarctica and the Arctic, featured in the new edition of The Times Comprehensive Atlas of the World published on 25 September 2014, reveal an unseen world of canyons, lakes, trenches and mountains. The 14th edition of the Atlas also includes a new double page map of the Arctic Ocean, which highlights the dramatic long-term decline of Arctic sea ice cover. The sub-ice maps draw on bedrock data, provided by the British Antarctic Survey, to show physical features which are obscured by ice cover. In the Antarctic, one of the most striking features is the Gamburtsev Subglacial Mountains, which are as large as the Alps but are currently completely covered by ice.
New maps of the sub-ice features in Antarctica and the Arctic, featured in the new edition of The Times Comprehensive Atlas of the World published on 25 September 2014, reveal an unseen world of canyons, lakes, trenches and mountains. The 14th edition of the Atlas also includes a new double page map of the Arctic Ocean, which highlights the dramatic long-term decline of Arctic sea ice cover.
!ADVERTISEMENT!
The sub-ice maps draw on bedrock data, provided by the British Antarctic Survey, to show physical features which are obscured by ice cover. In the Antarctic, one of the most striking features is the Gamburtsev Subglacial Mountains, which are as large as the Alps but are currently completely covered by ice.
Peter Fretwell of the British Antarctic Survey said:
"This is the first time that the Times Atlas has included a map of sub-ice Antarctica. The map shows details of the rocky bed beneath the massive ice sheets which cover the surface of the continent. Data for this map comes from the recent Bedmap2 compilation, a large multi-national project that merged 50 years of geophysical data to make a seamless model of ice thickness and sub-ice topography."
"It is very important to know how much ice there is and what the topography of the bed looks like, as this is one of the main controls on how quickly ice sheets melt with climate change. The data in Bedmap2 (the Antarctic bedrock survey) is a key component of the IPCC (Intergovernmental Panel on Climate Change) ice-sheet models that try to predict future sea-level rise; as the world warms with ever increasing greenhouse gas emissions Antarctic ice will start to melt and cause global sea levels to rise, but the speed and amount of sea-level rise is very dependent upon the bed-topography under the ice sheet."
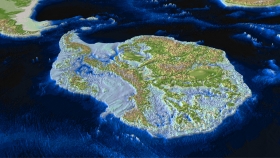
Image shows areas under sea level in blue, low areas in green, and mountains in brown and white. Credit BAS.
Read more at British Antarctic Survey.


