
Reducing the delivery of nutrients to the Chesapeake Bay is one of the most important components of restoration efforts to achieve a healthy Bay ecosystem. The United States Geologic Service (USGS) has developed a new method for tracking the progress toward reducing nitrogen and phosphorus delivery from the watershed to the Bay. When evaluating the quality of the water entering the Bay, this new method takes into consideration seasonality, variations in river flow, and the long-term trends that are driven by the wide range of human activities in the watershed, such as wastewater treatment and changing land management practices.
Reducing the delivery of nutrients to the Chesapeake Bay is one of the most important components of restoration efforts to achieve a healthy Bay ecosystem. The United States Geologic Service (USGS) has developed a new method for tracking the progress toward reducing nitrogen and phosphorus delivery from the watershed to the Bay. When evaluating the quality of the water entering the Bay, this new method takes into consideration seasonality, variations in river flow, and the long-term trends that are driven by the wide range of human activities in the watershed, such as wastewater treatment and changing land management practices.
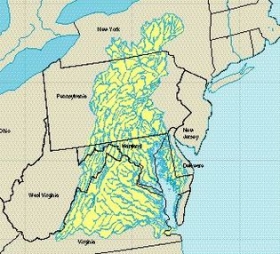
!ADVERTISEMENT!The Chesapeake Bay is the largest estuary in the United States. It lies off the Atlantic Ocean, surrounded by Maryland and Virginia. The Chesapeake Bay's drainage basin covers 64,299 square miles. More than 150 rivers and streams drain into the Bay.
The Chesapeake Bay is approximately 200 miles long, from the Susquehanna River in the north to the Atlantic Ocean in the south. At its narrowest point between Kent County's Plum Point (near Newtown) and the Harford County shore near Romney Creek, the Bay is 2.8 miles at its widest point, just south of the mouth of the Potomac River, it is 30 miles wide. The surface area of the bay and its major tributaries is 4,479 square miles. Average depth of the bay is 46 feet and the maximum depth is 208 feet.
The nine rivers studied are the Susquehanna, Potomac, James, Rappahannock, Appomattox, Pamunkey, Mattaponi, Patuxent and Choptank.
In the 1970s, the Chesapeake Bay was discovered to contain one of the planet's first identified marine dead zones, where hypoxic waters were so depleted of oxygen they were unable to support life, resulting in massive fish kills. Today the bay's dead zones are estimated to kill 75,000 tons of bottom-dwelling clams and worms each year. Hypoxia results in part from large algal blooms, which are nourished by the runoff of farm and industrial waste throughout the watershed. The runoff and pollution have many components that help contribute to the algal blooms which is mainly fed by phosphorus and nitrogen. This algae prevents sunlight from reaching the bottom of the bay while it is alive and deoxygenates the bay's water when it dies and rots.
"When we analyze long-term nutrient trends for the Chesapeake Bay or other major water systems, it’s important that we consider flow variations, because water quality can change greatly from year to year as a result of the random year-to-year variations in stream flow," said Robert Hirsch, USGS Research Hydrologist. "This new method enables us to remove this source of variation from the data and get a much clearer picture of the effect of human activities, including nutrient-management actions, on nutrient delivery from these watersheds to the Bay."
The analysis reveals both good and bad news about the progress being made regarding the reduction of nutrient inputs over the past 31 years, as well as the past decade. The study looked at dissolved nitrate plus nitrite and total phosphorus. Nitrogen and phosphorus are the primary nutrients that are responsible for creation of algal blooms.
Looking at the four largest rivers in this study, the results show that since 2000 nitrogen has been decreasing in the Susquehanna and Potomac Rivers and is nearly unchanged in the James and Rappahannock. During the same period phosphorus changed minimally in the Susquehanna; however, moderate decreases have occurred in the Potomac, and measurable increases have occurred in the James and the Rappahannock.
Methods that do not consider variations in stream flow can paint a much different picture of long-term nutrient trends in the Bay. For example, the years 1999-2002 were very dry years throughout the Chesapeake Bay watershed and as a consequence of that, nutrient delivery to the Bay was relatively low, and conditions in the Bay appeared to be much improved in those years. They were followed by extremely high flow conditions in 2003, and then a series of progressively drier years from 2004 through 2008. The 2003 data showed very poor conditions, but the subsequent years’ data suggest progressive improvements from one year to the next.
Additional Key Findings:
* Substantial improvement in the Patuxent River basin. Total phosphorus from this watershed declined by seventy-five percent from 1978 through 2000, and was essentially unchanged from 2000 through 2008. Nitrogen decreased by about twenty-six percent from 1978 through 2000 and an additional fifteen percent from 2000 to 2008. These results are likely due to large investments in advanced water treatment plants.
* Increase in nitrogen in the Choptank watershed on the Eastern Shore of the Chesapeake Bay: Nitrogen from the Choptank watershed increased thirty-six percent from 1978 to 2000, and a total of fifty-three percent for the whole period from 1978 to 2008. The new method shows that much of this increase takes place on those days when flow is almost entirely made up of groundwater flowing into the river.
For further information: http://www.usgs.gov/newsroom/article.asp?ID=2589&from=rss&utm_source=feedburner&utm_medium=feed&utm_campaign=Feed%3A+UsgsNewsroom+%28USGS+Newsroom%29&utm_content=Google+Reader


