
Nature's fury reached new extremes in the U.S. during the spring of 2011, as a punishing flooding and rainfall brought the greatest flood in recorded history to the Lower Mississippi River, an astonishingly deadly tornado season, the worst drought in Texas history, and the worst fire season in recorded history. There's never been a spring this extreme for combined wet and dry extremes in the U.S. since record keeping began over a century ago as shown by statistics released last week by the National Climatic Data Center. One other results is the Gulf of Mexico’s hypoxic zone is predicted to be larger than average this year, due to extreme flooding of the Mississippi River this spring, according to an annual forecast by a team of NOAA-supported scientists from the Louisiana Universities Marine Consortium, Louisiana State University and the University of Michigan. The forecast is based on Mississippi River nutrient inputs compiled annually by the U.S. Geological Survey. Scientists are predicting the area could measure between 8,500 and 9,421 square miles. The largest hypoxic zone measured to date occurred in 2002 and encompassed more than 8,400 square miles.
Nature's fury reached new extremes in the U.S. during the spring of 2011, as a punishing flooding and rainfall brought the greatest flood in recorded history to the Lower Mississippi River, an astonishingly deadly tornado season, the worst drought in Texas history, and the worst fire season in recorded history. There's never been a spring this extreme for combined wet and dry extremes in the U.S. since record keeping began over a century ago as shown by statistics released last week by the National Climatic Data Center. One other results is the Gulf of Mexico’s hypoxic zone is predicted to be larger than average this year, due to extreme flooding of the Mississippi River this spring, according to an annual forecast by a team of NOAA-supported scientists from the Louisiana Universities Marine Consortium, Louisiana State University and the University of Michigan. The forecast is based on Mississippi River nutrient inputs compiled annually by the U.S. Geological Survey. Scientists are predicting the area could measure between 8,500 and 9,421 square miles. The largest hypoxic zone measured to date occurred in 2002 and encompassed more than 8,400 square miles.
!ADVERTISEMENT!
The average hypoxia impacted area over the past five years is approximately 6,000 square miles, much larger than the 1,900 square miles which is the target goal set by the Gulf of Mexico/Mississippi River Watershed Nutrient Task Force.
Hypoxia is caused by excessive nutrient pollution, often from human activities such as agriculture that results in too little oxygen to support most marine life in bottom and near-bottom water. The hypoxic zone off the coast of Louisiana and Texas forms each summer and threatens valuable commercial and recreational Gulf fisheries. In 2009, the dockside value of commercial fisheries in the Gulf was $629 million. Nearly three million recreational fishers further contributed more than $1 billion to the Gulf economy taking 22 million fishing trips.
"This ecological forecast is a good example of NOAA applied science," said Jane Lubchenco, Ph.D., under secretary of commerce for oceans and atmosphere and NOAA administrator. "While there is some uncertainty regarding the size, position and timing of this year’s hypoxic zone in the Gulf, the forecast models are in overall agreement that hypoxia will be larger than we have typically seen in recent years."
During May 2011 stream-flow rates in the Mississippi and Atchafalaya Rivers were nearly twice that of normal conditions. This significantly increased the amount of nitrogen transported by the rivers into the Gulf. According to USGS estimates, 164,000 metric tons of nitrogen (in the form of nitrite plus nitrate) were transported by the Mississippi and Atchafalaya Rivers to the northern Gulf. The amount of nitrogen transported to the Gulf in May 2011 was 35 percent higher than average May nitrogen loads estimated in the last 32 years.
"The USGS monitoring network and modeling activities for water quantity and quality helps us connect the dots to see how increased nutrient run-off in the Mississippi watershed during a historic spring flood event impacts the health of the ocean many hundreds of miles away," said Marcia McNutt, Ph.D., USGS director.
The vast flooding was caused probably by La Niña.During a La Niña episode in the Eastern Pacific, when the equatorial waters cool to several degrees below average, abnormally dry winter weather usually occurs in the southern U.S., and abnormally wet weather in the Midwest. This occurs because La Niña alters the path of the jet stream, making the predominant storm track in winter traverse the Midwest and avoid the South. Cold, Canadian air stays north of the jet stream, and warm subtropical air lies to the south of the jet, bringing drought to the southern tier of states. La Niña's influence on the jet stream and U.S. weather typically fades in springtime, with precipitation patterns returning closer to normal. However, in 2011, the La Niña influence on U.S. weather stayed strong throughout spring. The jet stream remained farther south than usual over the Pacific Northwest and Midwest, and blew more strongly, with wind speeds more typical of winter than spring.
The positioning of the jet stream brought a much colder than average spring to the Pacific Northwest, with Washington and Oregon recording top-five coldest springs. Spring was not as cold in the Midwest, because a series of strong storms moved along the jet stream and pulled up warm, moist Gulf of Mexico air, which mixed with the cold air spilling south from Canada. The air flowing north from the Gulf of Mexico was much warmer than usual, because weaker winds than average blew over the Gulf of Mexico during February and March. This reduced the amount of mixing of cold ocean waters from the depths, and allowed the surface waters to heat up. Sea surface temperatures in the Gulf of Mexico warmed to 1.8°F above average during April--the third warmest temperatures in over a century of record keeping. These unusually warm surface waters allowed much more moisture than usual to evaporate into the air, resulting in unprecedented rains over the Midwest when the warm, moist air swirled into the unusually cold air spilling southwards from Canada.
For further information: http://www.noaanews.noaa.gov/stories2011/20110614_deadzone.html or http://www.wunderground.com/blog/JeffMasters/article.html
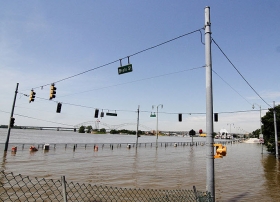
Photo: http://www.liveinsurancenews.com/wp-content/uploads/2011/05/Mississippi-Flood-20111.jpg


