NASA’s Aqua satellite passed over Tropical Storm Nalgae and gathered temperature data to determine the location of the most powerful storms.
NASA’s Aqua satellite passed over Tropical Storm Nalgae and gathered temperature data to determine the location of the most powerful storms.
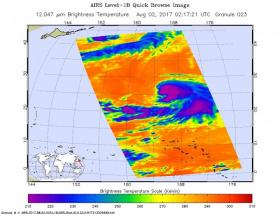
On Aug. 2 at 0217 UTC (Aug. 1 at 10:17 p.m. EDT), infrared data gathered from the Atmospheric Infrared Sounder or AIRS instrument that flies aboard NASA's Aqua satellite provided a look at the temperatures of Nalgae’s clouds.
In infrared imagery, the coldest cloud tops indicate towering thunderstorms high into the troposphere. The colder the clouds, the stronger the storms. AIRS data showed that some cloud tops east of Nalgae’s center of circulation were as cold as minus 63 degrees Fahrenheit or minus 53 degrees Celsius. Cloud top temperatures that cold have been shown to generate heavy rainfall. The data was false colored and made into an image at NASA's Jet Propulsion Laboratory in Pasadena, California to highlight cloud top temperatures.
On August 2 at 11 a.m. EDT (1500 UTC) Tropical Storm Nalgae had maximum sustained winds near 35 knots (40 mph/62 kph) and it is forecast to strengthen. Nalgae was centered near 26.8 degrees north latitude and 165.7 degrees east longitude, about 440 nautical miles north of Wake Island. Nalgae was moving to the north-northeast at 7 knots (8 mph/13 kph).
Read more at NASA/Goddard Space Flight Center
Image: This infrared image of Tropical Storm Nalgae was taken from the AIRS instrument aboard NASA's Aqua satellite on Aug. 2 at 0217 UTC (Aug. 1 at 10:17 p.m. EDT). The purple areas indicate coldest cloud tops and strongest storms. (Credit: NASA JPL, Ed Olsen)


