Drought is the world’s costliest natural disaster. To monitor, detect and quantify drought, many drought indices have been developed. Previous studies have shown that different indices can yield diverse results for a specific drought event, and a drought index can also give different results depending on the method used for the calculation of potential evapotranspiration (PET).
Drought is the world’s costliest natural disaster. To monitor, detect and quantify drought, many drought indices have been developed. Previous studies have shown that different indices can yield diverse results for a specific drought event, and a drought index can also give different results depending on the method used for the calculation of potential evapotranspiration (PET).
For instance, the Surface Wetness Index (SWI) is a ratio of annual precipitation to PET, which is the most widely accepted index used to define drylands. It does not feature any parametrization, standardization or post-processing, and is therefore certainly affected by different estimates of PET. However, the sensitivity of the SWI to different methods for calculating PET, in the context of the spatial distribution and temporal evolution of global drylands, has yet to be investigated.
In a new study published in Advances in Atmospheric Sciences, scientists from the Institute of Atmospheric Physics, Chinese Academy of Sciences, compared the spatiotemporal characteristics of global drylands based on the SWI with the Thornthwaite (PET_Th) and Penman–Monteith equations (PET_PM). “We find vast differences between PET_Th and PET_PM; however, the SWI derived from the two kinds of PET showed broadly similar characteristics in terms of the interdecadal variability of global and continental drylands,” says Dr. YANG Qing, the first author of the study. “This was because precipitation variations made major contributions, whereas PET changes contributed to a much lesser degree.”
Read more at Institute of Atmospheric Physics, Chinese Academy of Sciences
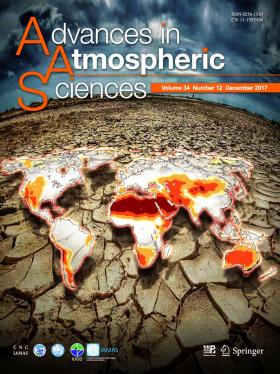
Image: Drylands are among those regions most sensitive to climate and environmental changes and human-induced perturbations. The cover image shows spatial distribution of global drylands defined by the Surface Wetness Index below 0.65. (Credit: Advances in Atmospheric Sciences)


