Water use across the country reached its lowest recorded level in nearly 45 years. According to a new USGS report, about 355 billion gallons of water per day (Bgal/d) were withdrawn for use in the entire United States during 2010.
This represents a 13 percent reduction of water use from 2005 when about 410 Bgal/d were withdrawn and the lowest level since before 1970.
“Reaching this 45-year low shows the positive trends in conservation that stem from improvements in water-use technologies and management,” said Mike Connor, deputy secretary of the Interior. “Even as the U.S. population continues to grow, people are learning to be more water conscious and do their part to help sustain the limited freshwater resources in the country.”
In 2010, more than 50 percent of the total withdrawals in the United States were accounted for by 12 states in order of withdrawal amounts: California, Texas, Idaho, Florida, Illinois, North Carolina, Arkansas, Colorado, Michigan, New York, Alabama and Ohio.
California accounted for 11 percent of the total withdrawals for all categories and 10 percent of total freshwater withdrawals for all categories nationwide. Texas accounted for about 7 percent of total withdrawals for all categories, predominantly for thermoelectric power, irrigation and public supply.
Florida had the largest saline withdrawals, accounting for 18 percent of the total in the country, mostly saline surface-water withdrawals for thermoelectric power. Oklahoma and Texas accounted for about 70 percent of the total saline groundwater withdrawals in the United States, mostly for mining.
“Since 1950, the USGS has tracked the national water-use statistics,” said Suzette Kimball, acting USGS director. “By providing data down to the county level, we are able to ensure that water resource managers across the nation have the information necessary to make strong water-use and conservation decisions.”
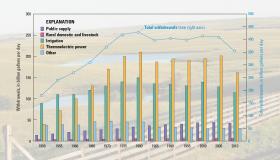
Graph shows trends in total water withdrawals by water-use category, 1950–2010. Credit USGS.
Water withdrawn for thermoelectric power was the largest use nationally, with the other leading uses being irrigation, public supply and self-supplied industrial water, respectively. Withdrawals declined in each of these categories. Collectively, all of these uses represented 94 percent of total withdrawals from 2005-2010.
- Thermoelectric power declined 20 percent, the largest percent decline.
- Irrigation withdrawals (all freshwater) declined 9 percent.
- Public-supply withdrawals declined 5 percent.
Self-supplied industrial withdrawals declined 12 percent.
Read more at U.S. Department of the Interior, U.S. Geological Survey.


