A team of scientists led by the Universities of Leicester and East Anglia are leading research to protect wildlife by using satellite data to identify monkey populations that have declined through hunting.
In a new article in the journal Nature Ecology and Evolution, a working group chaired by Professor Heiko Balzter, from the National Centre for Earth Observation at the University of Leicester, has looked at ways in which an array of technologies could be used to identify how many species are alive in an area and the risks they may be exposed to.
Using a combination of satellite and ground data, the team can map multiple indicators of monkey distribution, including human activity zones as inferred from roads and settlements, direct detections from mosquito-derived iDNA, animal sound recordings, plus detections of other species that are usually found when monkeys are present, such as other large vertebrates.
This data could be used to identify areas in which monkey populations are particularly vulnerable.
Professor Balzter explained: “There are ten times as many satellites in operation now as there were in the 1970s. Most people now use maps from Earth Observation on their mobile, such as Google Earth. The European Copernicus satellites now provide free global data every 5 days at 10m resolution. And think of small cube satellites that fit into a tote bag and weigh only 2kg. Satellite technology has undergone a massive change and has never been so accessible.
Read more at University of Leicester
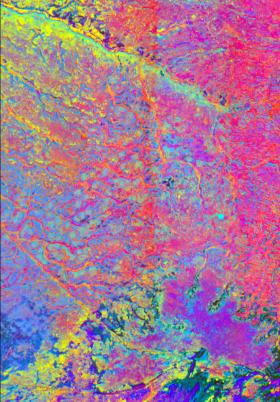
Image Caption: An example of the use of Earth Observation for monitoring ecosystem services. A false colour composite of predicted abundance of Graminoids (Red) Shrubs (Green) and Bryophytes (Blue) representing vegetation composition on a peatland from Partial Least Squares Regression models on a hyperspectral image. (Credit: University of Leicester / Dr Beth Cole)


