Every Canadian has a stake in helping to shape the country’s energy systems. But how do we make sense of the ever-increasing and complex information about issues such as pipeline safety, environmental impacts and economic benefits?
Every Canadian has a stake in helping to shape the country’s energy systems. But how do we make sense of the ever-increasing and complex information about issues such as pipeline safety, environmental impacts and economic benefits?
In a unique effort, a group of University of Calgary researchers is working with Canada’s energy regulator, the National Energy Board (NEB), on a three-year initiative to begin to turn the NEB’s vast array of energy data into clear, publicly accessible, online visual tools.
“Data visualization is a way of realizing the potential of data by helping people as individuals understand what’s there, and empowering them so they can use that data and make their own decisions,” says project co-principal investigator Sheelagh Carpendale, professor in the Faculty of Science’s Department of Computer Science and Canada Research Chair in Information Visualization.
Carpendale leads the Innovations in Visualization (InnoVis) interdisciplinary research group, part of the Interactions Laboratory (iLab). InnoVis includes computer scientists, designers, artists and engineers whose work encompasses information visualization, human-computer interaction and interactive art.
Continue reading at University of Calgary.
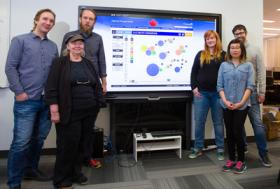
Photo via University of Calgary.


