
It’s been a busy five months for NASA’s newest carbon dioxide-monitoring satellite, snapping up to 1 million measurements a day of how carbon dioxide moves across the planet. Now NASA scientists have shared the first global maps created using that data, showing one of the most detailed views of CO2 ever created.
The satellite — known as OCO-2 — has been in orbit since July. While it’s returned some preliminary data, NASA showed off its global reach for the first time on Thursday at the annual American Geophysical Union meeting.
Over the next 200 years, the ocean is expected to rise 10 feet, putting many major cities worldwide underwater. Can we stop it?
According to deputy project science Annmarie Eldering, previous CO2-monitoring satellites were returning just 1-2 percent of the data that OCO-2 is sending back to Earth. And while the satellite can’t peer through clouds, it has still provided scientists with a staggering amount of information to create comprehensive maps of CO2 and plant growth.
“Measuring an atmospheric gas to a fraction of a percent makes OCO-2 one of the most challenging remote sensing missions that have ever been attempted,” Paul Wennberg, a professor at Caltech, said.
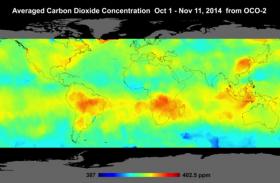
Map shows CO2 concentrations around the world in early November. (NASA via DiscoveryNews).
Read more at DiscoveryNews.


