
When millions of people are bracing themselves for the onslaught of extreme weather, as much information as possible is needed to predict the strength of any impending storm. As its name suggests, the Soil Moisture and Ocean Salinity (SMOS) satellite was designed to measure how much moisture is held in soil and how much salt is held in the surface waters of the oceans. Since SMOS has the ability to see through clouds and it is little affected by rain, it can also provide reliable estimates of the surface wind speeds under intense storms. This can be quite useful in tracking a storm system remotely and accurately.
When millions of people are bracing themselves for the onslaught of extreme weather, as much information as possible is needed to predict the strength of any impending storm. As its name suggests, the Soil Moisture and Ocean Salinity (SMOS) satellite was designed to measure how much moisture is held in soil and how much salt is held in the surface waters of the oceans. Since SMOS has the ability to see through clouds and it is little affected by rain, it can also provide reliable estimates of the surface wind speeds under intense storms. This can be quite useful in tracking a storm system remotely and accurately.
!ADVERTISEMENT!
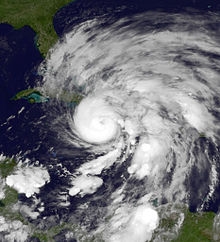
Unusually, Sandy was a hybrid storm, tapping energy from the evaporation of seawater like a hurricane and from different air temperatures like a winter storm. These conditions generated a super storm that spanned an incredible 1800 km.
As it orbited above, the satellite intercepted parts of Hurricane Sandy at least eight times as the storm swept over Jamaica and Cuba around 25 October, until its landfall in New Jersey, US, four days later.
The data from these encounters have been used to estimate the speed of the wind over the ocean’s surface.
SMOS carries a novel microwave sensor to capture images of brightness temperature. These images correspond to radiation emitted from the surface of Earth, which are then used to derive information on soil moisture and ocean salinity.
Strong winds over oceans whip up waves and whitecaps, which in turn affect the microwave radiation being emitted from the surface. This means that although strong storms make it difficult to measure salinity, the changes in emitted radiation can, however, be linked directly to the strength of the wind over the sea.
The method was originally used during Hurricane Igor in 2010, but has again proven accurate. During Hurricane Sandy, SMOS data compare well with realtime measurements from meteorological buoys as the super storm passed between the coast of the US and the Bermuda Islands.
Moreover, NOAA’s Hurricane Research Division flew a P-3 aircraft seven times into Hurricane Sandy to gather measurements of surface wind speeds, rain and other meteorological parameters. One of these airborne campaigns coincided with an overpass of the satellite.
Keeping in mind the significantly differing sampling characteristics between the SMOS radiometer and the aircraft sensor, there was excellent agreement in the measurements. Both instruments consistently detected a wind band 150 km south of the hurricane eye, with a speed of just over 100 km/h.
Being able to measure ocean surface wind in stormy conditions with the synoptic and frequent coverage of SMOS is paramount for tracking and forecasting hurricane strength.
For further information see SMOS.
Hurricane Sandy image via Wikipedia.


