Arctic sea ice appears to have reached on March 7 a record low wintertime maximum extent, according to scientists at NASA and the NASA-supported National Snow and Ice Data Center (NSIDC) in Boulder, Colorado. And on the opposite side of the planet, on March 3 sea ice around Antarctica hit its lowest extent ever recorded by satellites at the end of summer in the Southern Hemisphere, a surprising turn of events after decades of moderate sea ice expansion.
On Feb. 13, the combined Arctic and Antarctic sea ice numbers were at their lowest point since satellites began to continuously measure sea ice in 1979. Total polar sea ice covered 6.26 million square miles (16.21 million square kilometers), which is 790,000 square miles (2 million square kilometers) less than the average global minimum extent for 1981-2010 – the equivalent of having lost a chunk of sea ice larger than Mexico.
The ice floating on top of the Arctic Ocean and surrounding seas shrinks in a seasonal cycle from mid-March until mid-September. As the Arctic temperatures drop in the autumn and winter, the ice cover grows again until it reaches its yearly maximum extent, typically in March. The ring of sea ice around the Antarctic continent behaves in a similar manner, with the calendar flipped: it usually reaches its maximum in September and its minimum in February.
Read more at NASA / Goddard Space Flight Center
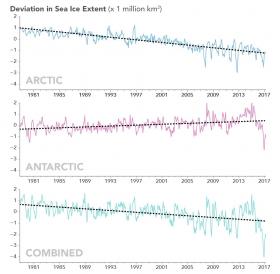
Graph: These line graphs plot monthly deviations and overall trends in polar sea ice from 1979 to 2017 as measured by satellites. The top line shows the Arctic; the middle shows Antarctica; and the third shows the global, combined total. The graphs depict how much the sea ice concentration moved above or below the long-term average. (They do not plot total sea ice concentration.) Arctic and global sea ice totals have moved consistently downward over 38 years. Antarctic trends are more muddled, but they do not offset the great losses in the Arctic.
Credits: Joshua Stevens / NASA Earth Observatory


