New maps of Greenland’s coastal seafloor and bedrock beneath its massive ice sheet show that two to four times as many coastal glaciers are at risk of accelerated melting as had previously been thought.
Researchers at the University of California, Irvine, NASA and 30 other institutions have published the most comprehensive, accurate and high-resolution relief maps ever made of Greenland’s bedrock and coastal seafloor. Among the many data sources incorporated into the new maps is data from NASA’s Ocean Melting Greenland campaign.
Lead author Mathieu Morlighem of UCI had demonstrated in an earlier study that data from OMG’s survey of the shape and depth, or bathymetry, of the seafloor in Greenland’s fjords improved scientists’ understanding of both the coastline and the inland bedrock beneath glaciers that flow into the ocean. That’s because the bathymetry at a glacier’s front limits the possibilities for the shape of bedrock farther upstream.
The nearer to the shoreline, the more valuable the bathymetry data are for understanding on-shore topography, Morlighem said. “What made OMG unique compared to other campaigns is that they got right into the fjords, as close as possible to the glacier fronts. That’s a big help for bedrock mapping,” he added.
Continue reading at University of California – Irvine (UCI)
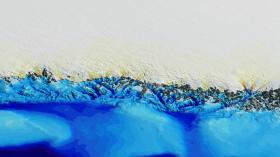
Image: UCI’s BedMachine ice mapping technique enabled the creation of a three-dimensional image of a portion of the northwest coast of Greenland. Ocean bathymetry is shown in blue and ice surface topography are displayed in white and orange.
Image Credit: Mathieu Morlighem / UCI


