
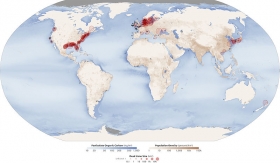
Dead zones are hypoxic (low-oxygen) areas in the world's oceans and large lakes, caused by excessive nutrient pollution from human activities coupled with other factors that deplete the oxygen required to support most marine life in bottom and near-bottom water. In the 1970s oceanographers began noting increased instances of dead zones. These occur near inhabited coastlines, where aquatic life is most concentrated. The vast middle portions of the oceans, which naturally have little life, are not considered dead zones. Scientists are expecting a very large dead zone in the Gulf of Mexico and a smaller than average hypoxic level in the Chesapeake Bay this year, based on several NOAA-supported forecast models. NOAA-supported modelers at the University of Michigan, Louisiana State University, and the Louisiana Universities Marine Consortium are forecasting that this year's Gulf of Mexico hypoxic dead zone will be between 7,286 and 8,561 square miles which could place it among the ten largest recorded. That would range from an area the size of Connecticut, Rhode Island and the District of Columbia combined on the low end to the New Jersey on the upper end. The high estimate would exceed the largest ever reported, 8,481 square miles in 2002.
Dead zones are hypoxic (low-oxygen) areas in the world's oceans and large lakes, caused by excessive nutrient pollution from human activities coupled with other factors that deplete the oxygen required to support most marine life in bottom and near-bottom water. In the 1970s oceanographers began noting increased instances of dead zones. These occur near inhabited coastlines, where aquatic life is most concentrated. The vast middle portions of the oceans, which naturally have little life, are not considered dead zones. Scientists are expecting a very large dead zone in the Gulf of Mexico and a smaller than average hypoxic level in the Chesapeake Bay this year, based on several NOAA-supported forecast models. NOAA-supported modelers at the University of Michigan, Louisiana State University, and the Louisiana Universities Marine Consortium are forecasting that this year's Gulf of Mexico hypoxic dead zone will be between 7,286 and 8,561 square miles which could place it among the ten largest recorded. That would range from an area the size of Connecticut, Rhode Island and the District of Columbia combined on the low end to the New Jersey on the upper end. The high estimate would exceed the largest ever reported, 8,481 square miles in 2002.
!ADVERTISEMENT!
Aspects of weather, including wind speed, wind direction, precipitation and temperature, also impact the size of dead zones.
The Gulf estimate is based on the assumption of no significant tropical storms in the two weeks preceding or during the official measurement survey cruise scheduled from July 25-August 3 2013. If a storm does occur the size estimate could drop to a low of 5344 square miles.
This year's prediction for the Gulf reflects flood conditions in the Midwest that caused large amounts of nutrients to be transported from the Mississippi watershed to the Gulf. Last year's dead zone in the Gulf of Mexico was the fourth smallest on record due to drought conditions, covering an area of approximately 2,889 square miles, an area slightly larger than the state of Delaware. The overall average between 1995-2012 is 5,960 square miles.
A second NOAA-funded forecast, for the Chesapeake Bay, calls for a smaller than average dead zone in the nation's largest estuary. The forecasts from researchers at the University of Maryland Center for Environmental Science and the University of Michigan has three parts: a prediction for the mid-summer volume of the low-oxygen hypoxic zone, one for the mid-summer oxygen-free anoxic zone, and a third that is an average value for the entire summer season.
The forecasts call for a mid-summer hypoxic zone of 1.46 cubic miles, a mid-summer anoxic zone of 0.26 to 0.38 cubic miles, and a summer average hypoxia of 1.108 cubic miles, all at the low end of previously recorded zones. Last year the final mid-summer hypoxic zone was 1.45 cubic miles.
This is the seventh year for the Bay outlook which, because of the shallow nature of large areas of the estuary, focuses on water volume or cubic miles, instead of square mileage as used in the Gulf.
"Monitoring the health and vitality of our nation's oceans, waterways, and watersheds is critical as we work to preserve and protect coastal ecosystems," said Kathryn D. Sullivan, Ph.D., acting under secretary of commerce for oceans and atmosphere and acting NOAA administrator. "These ecological forecasts are good examples of the critical environmental intelligence products and tools that help shape a healthier coast, one that is so inextricably linked to the vitality of our communities and our livelihoods."
During May 2013, stream flows in the Mississippi and Atchafalaya rivers were above normal resulting in more nutrients flowing into the Gulf. According to USGS estimates, 153,000 metric tons of nutrients flowed down the rivers to the northern Gulf of Mexico in May, an increase of 94,900 metric tons over last year's 58,100 metric tons, when the region was suffering through drought. The 2013 input is an increase of 16 percent above the average nutrient load estimated over the past 34 years.
For the Chesapeake Bay, USGS estimates 36,600 metric tons of nutrients entered the estuary from the Susquehanna and Potomac rivers between January and May, which is 30 percent below the average loads estimated from 1990 to 2013.
"Coastal hypoxia is proliferating around the world," said Donald Boesch, Ph.D., president of the University of Maryland Center for Environmental Science. "It is important that we have excellent abilities to predict and control the largest dead zones in the United States. The whole world is watching."
Despite the Mississippi River/Gulf of Mexico Nutrient Task Force's goal to reduce the dead zone to less than 2,000 square miles, it has averaged 5,600 square miles over the last five years. Demonstrating the link between the dead zone and nutrients from the Mississippi River, this annual forecast continues to provide guidance to federal and state agencies as they work on the 11 implementation actions outlined by the Task Force in 2008 for mitigating nutrient pollution.
Dead zones are reversible. The Black Sea dead zone, previously the largest in the world, largely disappeared between 1991 and 2001 after fertilizers became too costly to use following the collapse of the Soviet Union and the demise of centrally planned economies in Eastern and Central Europe. Fishing has again become a major economic activity in the region.
While the Black Sea cleanup was largely unintentional and involved a drop in hard-to-control fertilizer usage, the U.N. has advocated other cleanups by reducing large industrial emissions. From 1985 to 2000, the North Sea dead zone had nitrogen reduced by 37% when policy efforts by countries on the Rhine River reduced sewage and industrial emissions of nitrogen into the water. Other cleanups have taken place along the Hudson River and San Francisco Bay.
For further information see Predicted Dead Zone,
World Dead Zones image via Wikipedia.


