
Earthquakes are often imagined as opening up large gaps in the land, sinking islands and the such. It is much harder in real life to see this change. NASA has recently released the first ever airborne radar images of the deformation in Earth's surface caused by a major earthquake -- the magnitude 7.2 temblor that rocked Mexico's state of Baja California and parts of the American Southwest on April 4, 2010. The data reveal that in the area studied, the quake moved the Calexico, Calif., region in a downward and southerly direction up to 31 inches.
Earthquakes are often imagined as opening up large gaps in the land, sinking islands and the such. It is much harder in real life to see this change. NASA has recently released the first ever airborne radar images of the deformation in Earth's surface caused by a major earthquake -- the magnitude 7.2 temblor that rocked Mexico's state of Baja California and parts of the American Southwest on April 4, 2010. The data reveal that in the area studied, the quake moved the Calexico, Calif., region in a downward and southerly direction up to 31 inches.
!ADVERTISEMENT!The Calexico earthquake was the third major quake to rattle the western hemisphere in less than three months in April 2010. The quake was more powerful than the 7.0 earthquake in Haiti. It was also a relatively shallow earthquake, at six miles underground, meaning there was less earth to absorb the shaking. The quake affected about 20 million people primarily from being shaken and rattled.
It is difficult to measure how much deformation occurs after an earthquake. Traditionally it requires detailed land based surveying and inspection of the terrain and then comparing it to earlier measurements (if any). This traditional method of ground surveying can be difficult after an earthquake because the land surface has changed. Mapping ruptures typically means finding features that used to be continuous before the earthquake, like a road or fence.
Because of the difficulties of ground surveying, researchers have begun to investigate how satellite imagery can aid ground surveys and rescue work by generating more immediate maps of earthquake deformation. In theory, observing earthquake deformation should be as simple as comparing two optical satellite images that show the land surface before and after the earthquake.
A science team at NASA's Jet Propulsion Laboratory, Pasadena, Calif., used the Uninhabited Aerial Vehicle Synthetic Aperture Radar (UAVSAR) to measure surface deformation from the quake zone. The radar unit is flown at an altitude of 41,000 feet.
The April 4, 2010, quake was centered 32 miles south-southeast of Calexico, Calif., in northern Baja California. It occurred along a geologically complex segment of the boundary between the North American and Pacific tectonic plates. The quake, the region's largest in nearly 120 years, was also felt in southern California and parts of Nevada and Arizona.
There have been thousands of aftershocks, extending from near the northern tip of the Gulf of California to a few miles northwest of the U.S. border. The area northwest of the main rupture, along the trend of California's Elsinore fault, has been especially active, and was the site of a large, magnitude 5.7 aftershock on June 14, 2010.
"The goal of the ongoing study is to understand the relative hazard of the San Andreas and faults to its west like the Elsinore and San Jacinto faults, and capture ground displacements from larger quakes," said JPL geophysicist Andrea Donnellan, principal investigator of the UAVSAR project to map and assess seismic hazard in Southern California.
Each UAVSAR flight serves as a baseline for subsequent quake activity. The team estimates displacement for each region, with the goal of determining how much strain is partitioned between faults. When quakes do occur during the project, the team will observe their associated ground motions and assess how they may redistribute strain to other nearby faults.
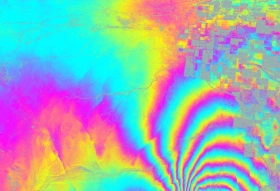
The resulting figures are color coordinated. Each color swath represents 4.7 inches of surface displacement. Major fault lines are marked in red, and recent aftershocks are denoted by yellow, orange and red dots.
The quake's maximum ground displacements of up to 10 feet actually occurred well south of where the UAVSAR measurements stop at the Mexican border.
UAVSAR is part of NASA's ongoing effort to apply space based technologies, ground based techniques and complex computer models to advance our understanding of quakes and quake processes. The radar flew over Hispaniola earlier this year to study geologic processes following January's devastating Haiti quake. The data are giving scientists a baseline set of imagery in the event of future quakes. These images can then be combined with post-quake imagery to measure ground deformation, determine how much slip on faults is distributed, and learn more about fault zone properties.
For further information: http://www.jpl.nasa.gov/news/news.cfm?release=2010-208&rn=news.xml&rst=2644


