
NASA researchers studying data from the Indian Space Research Organisation's (ISRO) Oceansat-2 satellite this month noticed that the ice melt area on Greenland covered almost the entire ice sheath. This is very unusual and means that melting was occurring over almost the entire surface of the ice sheath. In most summers, the melting occurs in portions of the ice sheath while other areas are not melting. Typically, less than half the ice sheath is melting at one time. At high elevations, most of that melt water quickly refreezes in place. Near the coast, some of the melt water is retained by the ice sheet, and the rest is lost to the ocean. But this year the extent of ice melting at or near the surface jumped dramatically. According to satellite data, an estimated 97 percent of the ice sheet surface thawed at some point in mid-July. This is unprecedented in 30 years of monitoring ice melt by satellite. Researchers have not yet determined whether this extensive melt event will affect the overall volume of ice loss this summer and contribute to sea level rise.
NASA researchers studying data from the Indian Space Research Organisation's (ISRO) Oceansat-2 satellite this month noticed that the ice melt area on Greenland covered almost the entire ice sheath. This is very unusual and means that melting was occurring over almost the entire surface of the ice sheath. In most summers, the melting occurs in portions of the ice sheath while other areas are not melting. Typically, less than half the ice sheath is melting at one time.
!ADVERTISEMENT!
At high elevations, most of that melt water quickly refreezes in place. Near the coast, some of the melt water is retained by the ice sheet, and the rest is lost to the ocean. But this year the extent of ice melting at or near the surface jumped dramatically. According to satellite data, an estimated 97 percent of the ice sheet surface thawed at some point in mid-July. This is unprecedented in 30 years of monitoring ice melt by satellite.
Researchers have not yet determined whether this extensive melt event will affect the overall volume of ice loss this summer and contribute to sea level rise.
"The Greenland ice sheet is a vast area with a varied history of change. This event, combined with other natural but uncommon phenomena, such as the large calving event last week on Petermann Glacier, are part of a complex story," said Tom Wagner, NASA's cryosphere program manager in Washington. "Satellite observations are helping us understand how events like these may relate to one another as well as to the broader climate system."
This extreme melt event coincided with an unusually strong ridge of warm air, or a heat dome, over Greenland. The ridge was one of a series that has dominated Greenland's weather since the end of May. "Each successive ridge has been stronger than the previous one," said Mote. This latest heat dome started to move over Greenland on July 8, and then parked itself over the ice sheet about three days later. By July 16, it had begun to dissipate.
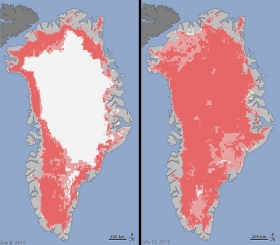
Maps show extent of surface melt over Greenland's ice sheet on July 8, 2012 (left) and July 12, 2012 (right). Measurements from three satellites showed that on July 8, about 40 percent of the ice sheet had undergone thawing at or near the surface. In just a few days, the melting had dramatically accelerated and an estimated 97 percent of the ice sheet surface had thawed by July 12. In the image, the areas classified as "probable melt" (light pink) correspond to those sites where at least one satellite detected surface melting. The areas classified as "melt" (dark pink) correspond to sites where two or three satellites detected surface melting.
Image credit: Jesse Allen, NASA Earth Observatory and Nicolo E. DiGirolamo, SSAI and Cryospheric Sciences Laboratory
Read more at NASA's Jet Propulsion Laboratory.


