Air pollution is a global problem, but it is not evenly distributed. Some areas are worse than others, of course. And air pollution can cause premature death from the diseases it can cause. Earth scientists studying air pollution have just released a map that shows air pollution deaths over time on a global scale. The stark map shown above was created at NASA Earth Observatory by data visualizer and designer Robert Simmon. This atmospheric computer model shows the average number of deaths per 386 square miles per year due to air pollution between 1850 and 2000. It’s based on data from Jason West, an assistant professor of environmental sciences and engineering at University of North Carolina. He and his colleagues published their findings earlier this year in Environmental Research Letters.
Earth scientists studying air pollution have just released a map that shows air pollution deaths over time on a global scale.
!ADVERTISEMENT!
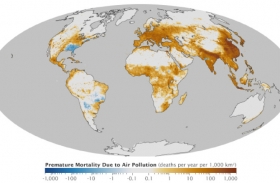
The stark map shown above was created at NASA Earth Observatory by data visualizer and designer Robert Simmon. This atmospheric computer model shows the average number of deaths per 386 square miles per year due to air pollution between 1850 and 2000. It’s based on data from Jason West, an assistant professor of environmental sciences and engineering at University of North Carolina. He and his colleagues published their findings earlier this year in Environmental Research Letters.
"Dark brown areas have more premature deaths than light brown areas," the NASA map explanation reads. The map shows that air pollution has been particularly deadly in eastern China, northern India and Europe — all areas where urbanization has added lots of fine particulate matter to the atmosphere since the Industrial Revolution began.
Blue areas on the map are locations where the scientists found a decline in premature deaths relative to 1850. They attribute those numbers to improvements in air quality. In the southeastern United States, the scientists think the change could have been caused by a decline in biomass burning in the past 160 years.
Pollution map via DiscoveryNews.
Read more at DiscoveryNews.


