
NASA has estimated rainfall from the Pineapple Express over the coastal regions southwestern Oregon and northern California from the series of storms in February, 2017.
The West Coast is once again feeling the effects of the "Pineapple Express." Back in early January one of these "atmospheric river" events, which taps into tropical moisture from as far away as the Hawaiian Islands, brought heavy rains from Washington state and Oregon all the way down to southern California. This second time around, many of those same areas were hit again. The current rains are a result of three separate surges of moisture impacting the West Coast. The first such surge in this current event began impacting the Pacific coastal regions of Washington, Oregon, and northern California on February 15.
The Integrated Multi-satellitE Retrievals for GPM (the Global Precipitation Measurement mission) or IMERG is used to estimate precipitation from a combination of passive microwave sensors, including GPM's microwave imager (GMI) and geostationary satellite infrared data. GPM is a joint mission between NASA and the Japanese space agency JAXA.
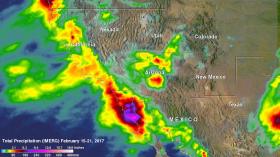
At NASA's Goddard Space Flight Center in Greenbelt, Maryland data from IMERG was used to create images and animations showing the rainfall. One image showed accumulated IMERG rainfall estimates for the period from Feb. 15 at 00:30 UTC (Feb. 14 at 7:30 p.m. EST) to Feb. 23 at 23:00 UTC (6 p.m. EST). The initial surge was responsible for bringing part of the rainfall (up to about 2 to 3 inches) was seen over the coastal regions southwestern Oregon and northern California.
Continue reading at NASA
Image: IMERG rainfall estimates for the period from Feb. 15 at 00:30 UTC (Feb. 14 at 7:30 p.m. EST) to Feb. 23 at 23:00 UTC (6 p.m. EST). The initial surge was responsible for bringing part of the rainfall (up to about 2 to 3 inches) was seen over the coastal regions southwestern Oregon and northern California.
Credits: NASA / JAXA, Hal Pierce


