
How vegetation phenology on the Tibetan Plateau (TP), the earth's largest surface area above 4000 m ASL, responds to climate change, in particular to rising temperatures, has attracted much attention in recent years. An increase in growth activity of high-elevation vegetation on the TP may have a considerable impact on the regional carbon budget.
How vegetation phenology on the Tibetan Plateau (TP), the earth's largest surface area above 4000 m ASL, responds to climate change, in particular to rising temperatures, has attracted much attention in recent years. An increase in growth activity of high-elevation vegetation on the TP may have a considerable impact on the regional carbon budget.
One widely used method for vegetation phenology is collection of satellite remote sensing data. However, divergent results from analysis of remote sensing results have been obtained regarding the rate of change in spring phenology and its relation to climatic drivers on the TP.
Furthermore, satellite remote sensing records only cover the last 30 years, thus significantly limiting the statistical confidence we can place in such methods of trend detection. A dataset that covers a much longer period is needed to resolve current disagreements.
Recently, a research group headed by Prof. YANG Bao from the Key Laboratory of Desert and Desertification, Northwest Institute of Eco-Environment and Resources of the Chinese Academy of Sciences, together with coauthors from Russia, Germany, Canada and Sweden, has reconciled these conflicting results based on a 55-year series of vegetation phenology for the TP derived from well-validated process-based Vaganov-Shashkin model (V-S) simulations of tree-ring growth data.
Read more at Chinese Academy of Sciences Headquarters
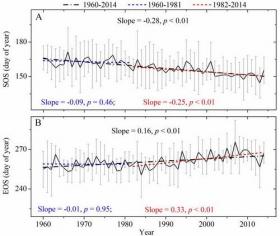
Image: Characteristics of all the averaged SOS (A) and EOS (B) on the entire study region during the period 1960-2014. Dashed lines indicate linear trends for the periods 1960-2014 (black line), 1982-2014 (red line) and 1960-1981 (blue line), respectively. Error bars indicate standard deviation among the 20 composite sites. (Credit: YANG Bao)


