
As Hurricane Harvey continued to strengthen, NASA analyzed the storm’s rainfall, cloud heights and cloud top temperatures. NASA’s GPM and Aqua satellite provided information while an animation of GOES-East satellite imagery showed Harvey’s progression toward the Texas coast.
Harvey's intensification has been aided by movement through an environment that includes low vertical wind shear and the warm waters in the Gulf of Mexico.
Analyzing Harvey’s Rainfall
The Global Precipitation Mission (GPM) core observatory satellite flew almost directly above intensifying Hurricane Harvey on August 24, 2017 at 6:30 p.m. EDT (2230 UTC) when maximum sustained winds had increased to about 86 mph (75 knots). GPM's Microwave Imager (GMI) instrument peered through dense storm clouds to reveal the location of intense rainfall bands near the center of the hurricane. The Goddard Profiling Algorithm (GPROF), using GMI data, indicated that powerful storms in the hurricane were dropping rain at a rate of over 2.1 inches (54 mm) per hour. GPM is a joint mission between NASA and the Japan Aerospace Exploration Agency, JAXA.
Read more at NASA / Goddard Space Flight Center
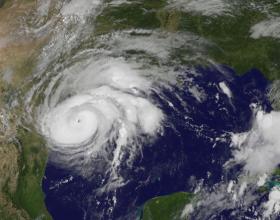
Image: This visible image of Hurricane Harvey taken from NOAA’s GOES East satellite on Aug. 25 at 10:07 a.m. EDT (1407 UTC) clearly showed the storm’s eye as the storm nears landfall in the southeastern coast of Texas.
Credits: NASA / NOAA GOES Project


