
For the first time, engineers at Caltech have developed an empirical statewide model of the California reservoir network. The model was built from data gathered over a 13-year period that includes the latest drought, allowing researchers to make observations about how 55 of the state's major reservoirs respond to a variety of external conditions as a unified system.
For the first time, engineers at Caltech have developed an empirical statewide model of the California reservoir network. The model was built from data gathered over a 13-year period that includes the latest drought, allowing researchers to make observations about how 55 of the state's major reservoirs respond to a variety of external conditions as a unified system.
Reservoirs act as the state's buffer against climate variability, stockpiling water during the rainy season for use during the dry. The water may be released to generate hydroelectric power, and can be diverted to agriculture and residential consumption. Meanwhile, a reservoir itself is often used for recreational purposes, such as swimming and boating. The reservoirs are interconnected in that they are placed along major waterways, with some downstream of others, and also because they can receive similar amounts of water input and can be subject to similar management decisions.
The managers of these facilities must maintain a baseline amount of water in each reservoir. As the water level drops closer to that minimum mark, they dial back the amount of water released, which in turn affects all of the reservoirs downstream. Reservoir managers try to avoid having to shut off the water release completely, since that can have catastrophic consequences for farms and communities that rely on the water. The behavior of a reservoir—the rising and falling of the water level—is determined in part by shifts in the climate and in part by the humans managing the outflow of the reservoir. These two components can make reservoir storage challenging to predict.
Read more at California Institute of Technology
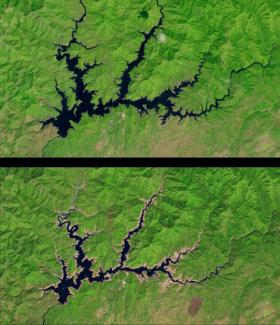
Image: Satellite images show a 50 percent decrease in the water level of Shasta Lake between September 2011 (top) and September 2014 (bottom). Shasta Lake was among the 55 major California reservoirs included in this model. (Credit: USGS/NASA, Landsat 5 (2011); Landsat 8 (2014))


