
Infrared imagery provides valuable temperature data in storms, and when NASA’s Aqua satellite flew over newly developed Tropical Cyclone 11S in the Southern Indian Ocean, its gathered that data allowing forecasters to see where the strongest storms were located within.
Infrared imagery provides valuable temperature data in storms, and when NASA’s Aqua satellite flew over newly developed Tropical Cyclone 11S in the Southern Indian Ocean, its gathered that data allowing forecasters to see where the strongest storms were located within.
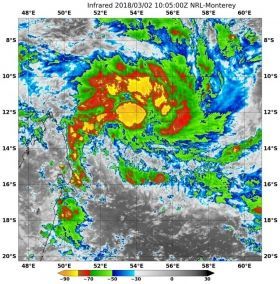
The Moderate Resolution Imaging Spectroradiometer is the instrument aboard NASA’s Aqua satellite that provided the infrared data on Tropical Cyclone 11S. Imagery from March 2 at 5:05 a.m. EST (10:05 UTC) showed coldest cloud top temperatures in storms circling the low-level center of circulation and in a large fragmented band of thunderstorms in the northern quadrant on the tropical cyclone. Temperatures in those areas were as cold as minus 80 degrees Fahrenheit (minus 62.2 Celsius).Cloud top temperatures that cold indicate strong storms that have the capability to create heavy rain.
On March 2 at 10 a.m. EST (1500 UTC) Tropical Cyclone 11S had maximum sustained winds are near 45 knots (52 mph/74 kph). Tropical Cyclone 11S is expected to rapidly intensify by 55 knots (63 mph/102 kph) in 48 hours because of warm waters and low vertical wind shear.
Read more at NASA/Goddard Space Flight Center
Image: On March 2 at 5:05 a.m. EST (10:05 UTC) NASA's Aqua satellite found cloud top temperatures of strongest thunderstorms (yellow) in Tropical Storm 11S. Temperatures were as cold as or colder than minus 80 degrees Fahrenheit (minus 62.2 Celsius). (Credit: NRL/NASA)


