
Infrared NASA satellite imagery provided cloud top temperatures of thunderstorms that make up Tropical Storm Emilia. Comparing those NASA temperature readings with another satellite’s data obtained the following day, forecasters determined that Emilia had strengthened.
Infrared NASA satellite imagery provided cloud top temperatures of thunderstorms that make up Tropical Storm Emilia. Comparing those NASA temperature readings with another satellite’s data obtained the following day, forecasters determined that Emilia had strengthened.
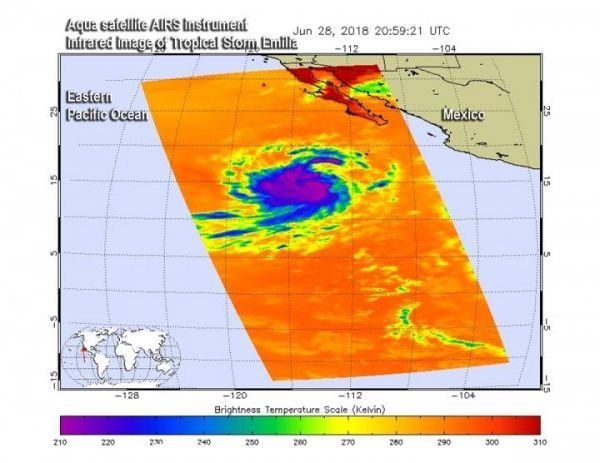
At NASA's Jet Propulsion Laboratory in Pasadena, California, infrared data taken of Emilia by the Atmospheric Infrared Sounder or AIRS instrument that flies aboard NASA's Aqua satellite was made into a false-colored infrared image. That data from June 28 at 4:59 p.m. EDT (2059 UTC) revealed powerful storms with very cold cloud top temperatures in excess of minus 63 degrees Fahrenheit (minus 53 degrees Celsius) around the center.
By Friday, June 29, 2018 the National Hurricane Center noted that those cloud tops had cooled, indicating the uplift in the storm was stronger, and the cloud tops were higher. That means the storm was intensifying. NHC said “Shortwave infrared imagery and an earlier [4:55 a.m. EDT] 0855 UTC polar orbiter (satellite) pass show deep convective bursts, with associated minus 78 degree Celsius [minus 108.4 degrees Fahrenheit] cloud tops, developing near the surface center.”
Emilia is far enough away from land so that there are no coastal watches or warnings in effect.
Read more at NASA/Goddard Space Flight Center
Image: On June 28 at 4:59 p.m. EDT (2059 UTC) the AIRS instrument aboard NASA's Aqua satellite showed powerful storms with very cold cloud top temperatures (purple) in excess of minus 63 degrees Fahrenheit. (Credit: NASA JPL, Heidar Thrastarson)


