
Nineteen inundation maps and detailed flood information from Hurricane Harvey are now available from the U.S. Geological Survey, in cooperation with the Federal Emergency Management Agency
Nineteen inundation maps and detailed flood information from Hurricane Harvey are now available from the U.S. Geological Survey, in cooperation with the Federal Emergency Management Agency. Hurricane Harvey was the most significant rainfall event in U.S. history, both in scope and peak rainfall amounts, since records began in the 1880s.
Hurricane Harvey’s widespread 8-day rainfall, which started on August 25, 2017, exceeded 60 inches in some locations, which is about 15 inches more than average annual amounts of rainfall for eastern Texas and the Texas coast. The second largest rainfall event recorded in continental U.S. history was during Tropical Storm Amelia in 1978, which left Texas Hill Country with 48 inches of rain. Not only were rainfall totals exceptional during Hurricane Harvey, the area affected was also larger than previous events.
In the immediate aftermath of Harvey, the USGS and FEMA initiated a study to evaluate the magnitude of flooding, determine the probability of future occurrence and map the extent of the flooding in Texas. USGS field crews collected 2,123 high-water marks in 22 counties in southeast Texas and three parishes across southwest Louisiana. Although parts of central Louisiana experienced Harvey related flooding, this report only documents the extent of flooding in southwest Louisiana along the Sabine River. High-water mark data, along with flood flow information from USGS streamgages, were used to create 19 inundation maps to document the areal extent and depth of the flooding.
Continue reading at USGS.
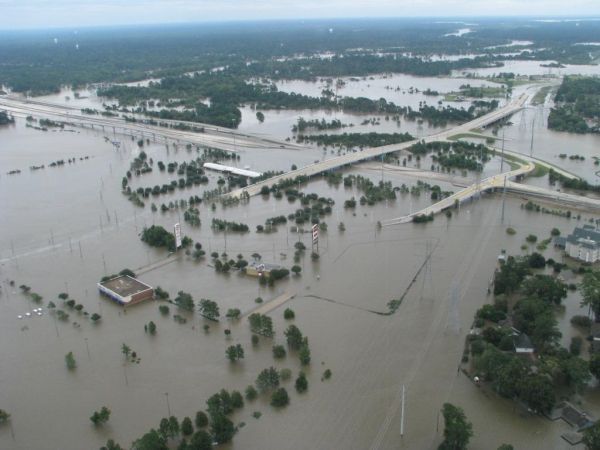
Image via Harris County Flood Control District.


