
A new, highly accurate MRI technique can monitor iron levels in the brains of multiple sclerosis (MS) patients and help identify those at a higher risk for developing physical disability, according to a study published in the journal Radiology.
A new, highly accurate MRI technique can monitor iron levels in the brains of multiple sclerosis (MS) patients and help identify those at a higher risk for developing physical disability, according to a study published in the journal Radiology.
MS is a disease that attacks three critical components of the central nervous system: the neurons (nerve fibers), myelin (the protective sheath around the neurons), and the cells that produce myelin. Common symptoms of MS include weakness, spasticity and pain. The disease can progress in many patients, leaving them severely disabled. Brain atrophy is the current gold standard for predicting cognitive and physical decline in MS, but it has limitations, said study lead author Robert Zivadinov, M.D., Ph.D., professor of neurology at the Jacobs School of Medicine and Biomedical Sciences at the University at Buffalo (UB) in Buffalo, N.Y. He is director of the Buffalo Neuroimaging Analysis Center in the Jacobs School and the Center for Biomedical Imaging at UB’s Clinical and Translational Science Institute.
“Brain atrophy takes a long time to see,” he said. “We need an earlier measure of who will develop MS-related disability.”
MRI studies of iron concentration have emerged recently as a promising measure of changes in the brain associated with MS progression. Iron is vital for various cellular functions in the brain, including myelination of neurons, and both iron overload and iron deficiencies can be harmful.
Read more at Radiological Society of North America
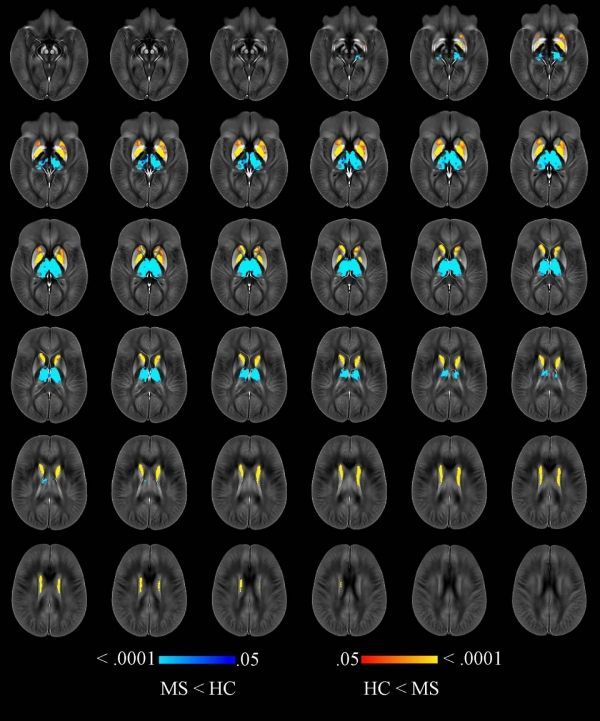
Image: Image shows voxelwise analysis of quantitative susceptibility maps within thalamus, caudate, globus pallidus, and putamen comparing all participants with multiple sclerosis (MS) to healthy control (HC) participants. Areas of higher susceptibility in participants with MS compared with HC participants are shown in red-yellow. Areas of lower susceptibility in participants with MS compared with HC participants are shown in blue-light blue. (Credit: Radiological Society of North America (RSNA))


