
At the end of July, Twitter user Alicia Santana posted a photo of a man sitting in a plastic folding chair in his yard. He’s looking away from the camera, towards a monstrous, orange cloud of smoke filling the sky beyond a wire fence. “My dad not wanting to leave his home,” Santana wrote, ending it with #MendocinoComplexFire.
At the end of July, Twitter user Alicia Santana posted a photo of a man sitting in a plastic folding chair in his yard. He’s looking away from the camera, towards a monstrous, orange cloud of smoke filling the sky beyond a wire fence. “My dad not wanting to leave his home,” Santana wrote, ending it with #MendocinoComplexFire.
As wildfires spark, parts of the internet glow with them. The #CarrFire, #FergusonFire, #RanchFire and other hashtags spread quickly this summer on Twitter. If past seasons are any indication, there will be thousands more tweets like this, and they will continue as smoke—the insidious second wave of wildfires—spreads across the West. They can also be used for data. In a recently published study, US Forest Service researchers Sonya Sachdeva and Sarah McCaffrey found that, when analyzed in large numbers, tweets about wildfires can accurately model the way smoke moves.
In their study, published by the International Conference on Social Media & Society, Sachdeva and McCaffrey analyzed close to 39,000 tweets posted between May and September 2015 in California. They stripped the tweets to reveal their core subjects: smoke in the air, fallen ash, haziness, smell. By tagging the tweets with the location in which they were posted, the researchers created a verbatim map: a landscape of fire based on the people who experienced it. Their modeling proved accurate when compared to figures from air quality monitors.
Read more at Wired
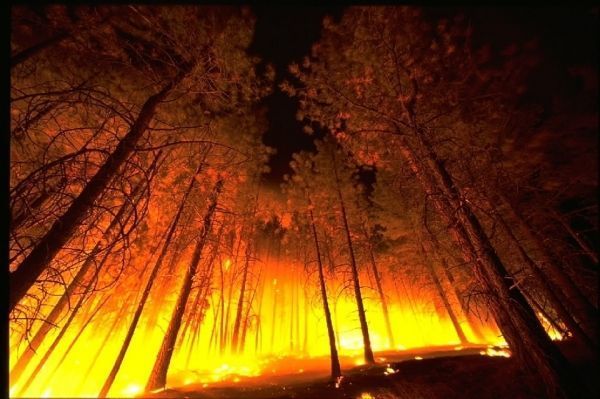
Photo Credit: skeeze via Pixabay


