
NASA’s Aqua satellite provided an infrared look at Tropical Storm Isaac that revealed its circulation center was displaced from the bulk of clouds and precipitation. That’s an indication that wind shear is affecting the storm.
NASA’s Aqua satellite provided an infrared look at Tropical Storm Isaac that revealed its circulation center was displaced from the bulk of clouds and precipitation. That’s an indication that wind shear is affecting the storm.
What is Vertical Wind Shear?
In general, wind shear is a measure of how the speed and direction of winds change with altitude. In order to understand how it affects a tropical cyclone or hurricane, think of a tropical cyclone as a series of vertically stacked tires, all rotating. As you go up from the ground, each tire represents the rotation of the storm’s center at a higher level in the atmosphere. The different levels of rotating winds in the center of Tropical cyclones need to be stacked on top each other to strengthen. If there are winds higher up that push some of the tires askew near the top, it affects the balance and rotation of the tires below. That’s what happens when vertical wind shear pushes against a storm. It pushes the center and weakens (or wobbles) the rotation of all of the tires.
The Satellite Data Reveal
The National Hurricane Center or NHC noted “Satellite images indicate that the strong tropical storm still has a central dense overcast pattern and a limited amount of outer bands [of thunderstorms]. Earlier microwave data indicated that the center was not located in the middle of the convection, however, likely due to some westerly [wind] shear.”
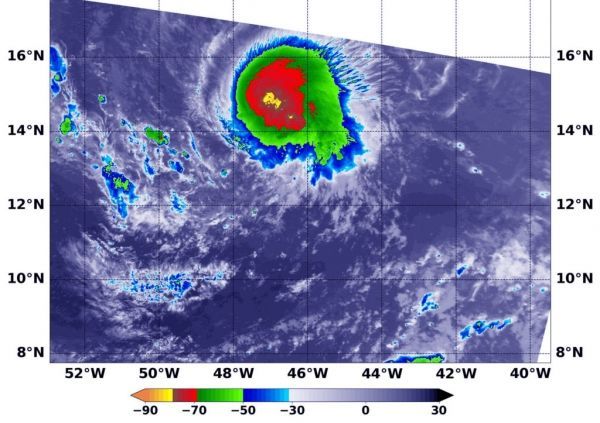
At 2:30 a.m. EDT (0630 UTC) on Sept. 11, the Moderate Resolution Imaging Spectroradiometer or MODIS instrument aboard NASA’s Aqua satellite analyzed Tropical Storm Isaac in infrared light. MODIS found coldest cloud top temperatures off-center were as cold as or colder than minus 80 degrees Fahrenheit (minus 112 degrees Celsius). Those most powerful storms were embedded in strong storms with cloud tops as cold as or colder than minus 70 degrees Fahrenheit (minus 56.6 degrees Celsius).
Read more at NASA/Goddard Space Flight Center
Image: At 1 a.m. EDT (0500 UTC) on Sept. 11, the MODIS instrument aboard NASA’s Aqua satellite looked at Tropical Storm Isaac in infrared light. MODIS found coldest cloud top temperatures off-center as cold as or colder than minus 80 degrees (yellow) Fahrenheit (minus 112 degrees Celsius). Those most powerful storms were embedded in strong storms with cloud tops as cold as or colder than minus 70 degrees (red) Fahrenheit (minus 56.6 degrees Celsius). (Credit: NASA/NRL)


