
At NASA’s Goddard Space Flight Center in Greenbelt, Md. data was used to create a map of rainfall generated by Super Typhoon Mangkhut.
At NASA’s Goddard Space Flight Center in Greenbelt, Md. data was used to create a map of rainfall generated by Super Typhoon Mangkhut.
Compared to hurricane Florence, that stalled over the state of North Carolina, super typhoon Mangkhut moved fairly quickly across the western Pacific. Mangkhut killed at least 81 people in the Philippines. The typhoon’s rainfall caused a landslide in the northern Philippines that killed at least 66 people. At least four people in China and one person in Taiwan were also reported victims of Mangkhut. When it was moving between the Marianas and the Philippines the typhoon had sustained winds reported at 155 knots (178 mph). Wind speeds of 135 knots (155 mph) were reported when it hit Hong Kong. This made it the most intense tropical cyclone in Hong Kong’s history.
The NASA rainfall accumulation analysis was derived from NASA’s Integrated Multi-satellitE Retrievals for GPM data (IMERG). GPM is the Global Precipitation Measurement mission satellite, managed by both NASA and the Japan Aerospace Exploration Agency.
Read more at NASA / Goddard Space Flight Center
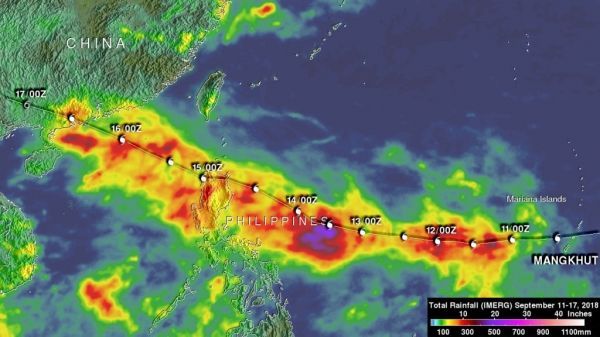
Image: The NASA analysis showed IMERG rainfall estimates over the western Pacific Ocean during the period from September 11-17, 2018. Rainfall totals above 300 mm (11.8 inches) were often indicated along Mangkhut’s path. The highest rainfall accumulation estimates of over 700 mm (27.6 inches) were shown by IMERG south of Mangkhut’s track in the Philippine Sea. CREDIT: NASA / JAXA, Hal Pierce


