
NASA’s Aqua satellite peered into Hurricane Sergio with infrared light to determine if the storm was intensifying or weakening. Infrared data showed cloud top temperatures were getting warmer on the western half of the storm, indicating the uplift of air in storms had weakened.
NASA’s Aqua satellite peered into Hurricane Sergio with infrared light to determine if the storm was intensifying or weakening. Infrared data showed cloud top temperatures were getting warmer on the western half of the storm, indicating the uplift of air in storms had weakened.
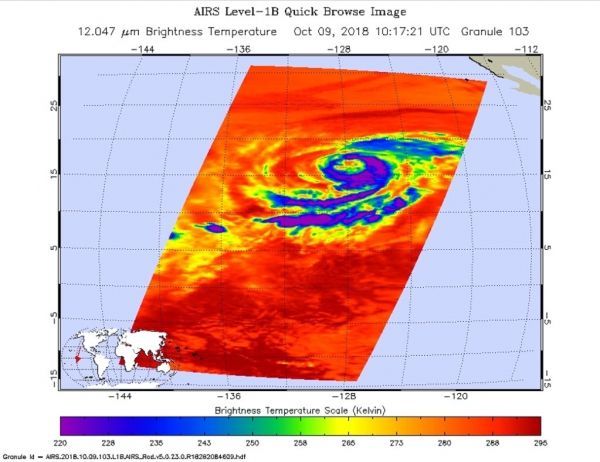
The Atmospheric Infrared Sounder or AIRS instrument aboard NASA’s Aqua satellite passed over Hurricane Sergio on Oct. 9 at 6:17 a.m. EDT (1017 UTC). AIRS uses infrared light and infrared light provides scientists with temperature data and that’s important when trying to understand how strong storms can be. The higher the cloud tops, the colder and the stronger they are. So infrared light as that gathered by the AIRS instrument can identify the strongest areas of a tropical cyclone.
At the time Aqua passed overhead, coldest cloud top temperatures in thunderstorms circled the eye and appeared in fragmented bands of thunderstorms north and south of the center. Those temperatures were as cold as or colder than minus 63 degrees Fahrenheit (minus 53 degrees Celsius). The exception was on the western side of the storm, where cloud top temperatures were warming, meaning they were not getting as high in the atmosphere.
Read more at NASA / Goddard Space Flight Center
Image: NASA’s Aqua satellite provided an infrared picture of Hurricane Sergio’s cloud top temperatures from Oct. 9 at 6:17 a.m. EDT (1017 UTC). Strongest storms circled the eye (purple) and appeared in fragmented bands of thunderstorms north and south of the center. CREDIT: NASA JPL, Heidar Thrastarson


