
When NASA’s Aqua satellite passed over the Eastern Pacific Ocean on Oct. 16 the MODIS instrument aboard analyzed water vapor within Tropical Storm Tara.
When NASA’s Aqua satellite passed over the Eastern Pacific Ocean on Oct. 16 the MODIS instrument aboard analyzed water vapor within Tropical Storm Tara.
On Oct. 16, a Tropical Storm Warning is in effect from Manzanillo to Cabo Corrientes, Mexico and a Tropical Storm Watch is in effect from east of Manzanillo to Punta San Telmo, Mexico.
Water vapor analysis of tropical cyclones tells forecasters how much potential a storm has to develop and shows where the heaviest rainfall may be found. Water vapor releases latent heat as it condenses into liquid. That liquid becomes clouds and thunderstorms that make up a tropical cyclone. Temperature is important when trying to understand how strong storms can be. The higher the cloud tops, the colder and the stronger they are.
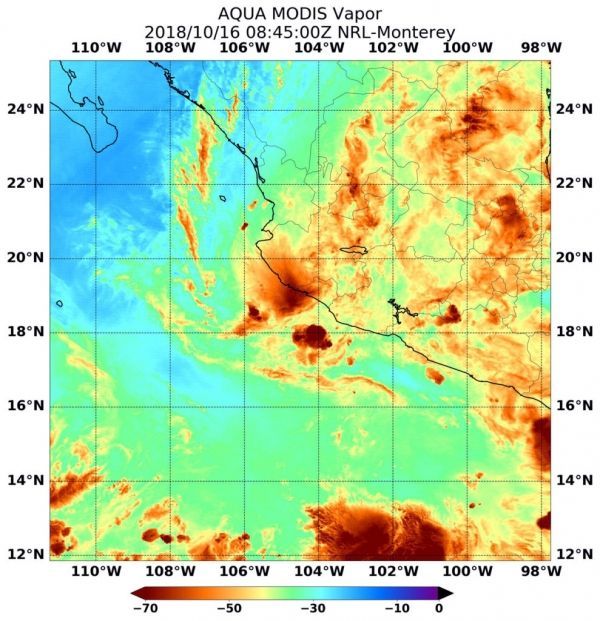
NASA’s Aqua satellite passed over Tropical Storm Tara on Oct. 16 at 4:45 a.m. EDT (0845 UTC) and the Moderate Resolution Imaging Spectroradiometer or MODIS instrument gathered water vapor content and temperature information. The MODIS image showed highest concentrations of water vapor and coldest cloud top temperatures circled the center and extended in areas over mainland Mexico to the north-northeast including the coast.
Read more NASA / Goddard Space Flight Center
Image: NASA’s Aqua satellite passed over Tropical Storm Tara in the Eastern Pacific Ocean on Oct. 16 at 4:45 a.m. EDT (0845 UTC). The MODIS instrument showed highest concentrations of water vapor (brown) and coldest cloud top temperatures were around the center (over water) and north of the center over western Mexico. CREDITS: NASA / NRL


