
Many of the world’s largest cities are built near coasts, be it along rivers or oceans.
Many of the world’s largest cities are built near coasts, be it along rivers or oceans. Humanity relies on waterways for transportation, trade, and sustenance. However, waterways can also unleash devastating floodwaters that lead to billions in damage, loss of life, and years-long clean-up efforts.
Two geographically distinct areas that are prone to dealing with the fury of flood waters, the Canadian province of Quebec and the German state of Bavaria have been collaborating for a decade to investigate the impacts of climate change on water resources. The latest endeavor of this partnership, the ClimEx Project, aims to improve researchers’ understanding of severe flooding dynamics under changing climate conditions. “This knowledge is of fundamental importance,” says Prof. Dr. Ralf Ludwig, Geography Professor at Munich’s Ludwig-Maximilians-Universität (LMU) and project leader of ClimEx. “Understanding these phenomena helps us better prepare and improve adaptation to the increasing extreme events we expect to face in our future.”
“The goal of ClimEx is to investigate extreme floods associated with long return periods,” said Martin Leduc, climate researcher at the non-profit research organization Ouranos and partner in the ClimEx project. “If you look at observations, you only have a relatively short time period to reference—often less than 30 years of accurate, detailed data. For the most extreme floods, these are once-a-century phenomena.”
In order to efficiently model long-term climate trends, the ClimEx collaborators are using the SuperMUC supercomputer at the Leibniz Supercomputing Centre (LRZ). The team published its most recent results in the Journal of Applied Meteorology and Climatology, simulating the climate in Quebec and Bavaria from 1950 to 2100.
Read more at Gauss Centre for Supercomputing
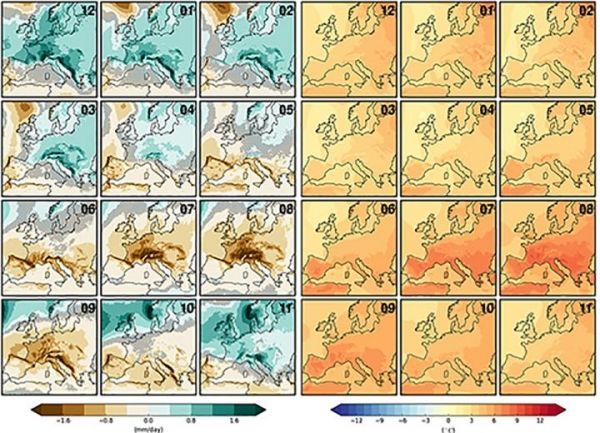
Image: Using the CRCM5 climate model, researchers calculated climate changes in Europe and northeastern North America from 1950-2100. Comparing data from 2000-2019 and 2080-2099, the image on the left shows changes in monthly precipitation over Europe, while the image on the right shows the mean change in monthly surface-air temperature. (Credit: Leduc, et al.)


