
An infrared look by NASA’s Aqua satellite revealed where the strongest storms were located within the Southern Pacific Ocean’s Tropical Cyclone Oma.
An infrared look by NASA’s Aqua satellite revealed where the strongest storms were located within the Southern Pacific Ocean’s Tropical Cyclone Oma.
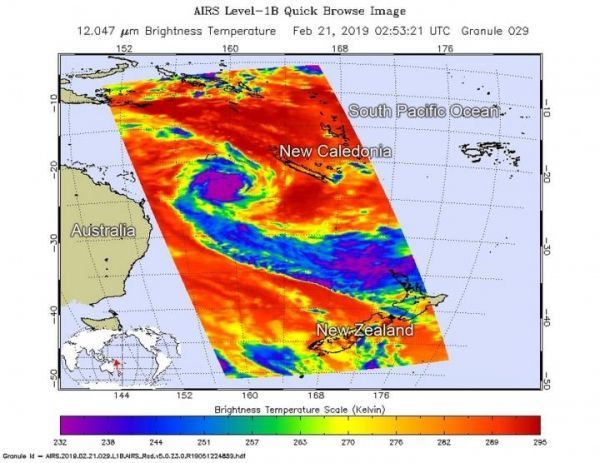
On Feb. 20 at 9:53 p.m. EDT (0253 UTC on Feb. 21) the Atmospheric Infrared Sounder or AIRS instrument aboard NASA’s Aqua satellite analyzed cloud top temperatures of Tropical Cyclone Oma in infrared light. AIRS found cloud top temperatures of strongest thunderstorms as cold as or colder than minus 63 degrees Fahrenheit (minus 53 degrees Celsius) circling the center. Cloud top temperatures that cold indicate strong storms that have the capability to create heavy rain. Cloud top temperatures over the bands of thunderstorms feeding into the low-level center have warmed. That’s indicative of a weakening storm. The higher in the atmosphere, the colder the cloud top. When cloud tops warm, it means the uplift of air that pushes them, has weakened.
Read more at NASA/Goddard Space Flight Center
Image: On Feb. 20 at 9:53 p.m. EDT (0253 UTC, Feb. 21) the AIRS instrument aboard NASA's Aqua satellite analyzed cloud top temperatures of Tropical Cyclone Oma in infrared light. AIRS found cloud top temperatures of strongest thunderstorms were as cold as or colder than minus 63 degrees Fahrenheit (minus 53 degrees Celsius). (Credit: NASA JPL/Heidar Thrastarson)


