
Hurricane Harvey made landfall on Aug. 25, 2017, then stalled over Texas for three days as a tropical storm.
Hurricane Harvey made landfall on Aug. 25, 2017, then stalled over Texas for three days as a tropical storm. The Category 4 storm claimed 80 lives, displaced multitudes of people and damaged more than 80,000 homes.
Arizona State University researcher Manoochehr Shirzaei of the School of Earth and Space Exploration and former graduate student and lead author Megan Miller (now a postdoctoral researcher at the Jet Propulsion Laboratory, California Institute of Technology) used satellite data to map the Houston-Galveston area impacted by Hurricane Harvey to understand why the flooding was so severe and widespread. The results of their study have been recently published in the journal Remote Sensing of Environment.
Mapping Eastern Texas with satellites and radar
For their study, Miller and Shirzaei mapped the Eastern Texas area of Houston-Galveston impacted by Hurricane Harvey using satellite radar data collected from the European Space Agency’s Sentinel-1 A/B satellites and Japan Aerospace Exploration Agency’s Advanced Land Observing Satellite. From this data, Miller and Shirzaei then compiled a snapshot of the extent of standing water in the area following the hurricane.
Read more at Arizona State University
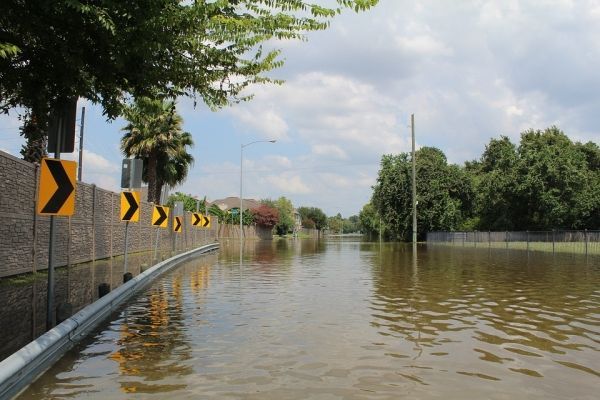
Photo Credit: andrewtheshrew via Pixabay


