
Today, the U.S. Geological Survey (USGS) released the latest edition of the National Land Cover Database (NLCD) for the U.S. – the most comprehensive land cover database that the USGS has ever produced.
Today, the U.S. Geological Survey (USGS) released the latest edition of the National Land Cover Database (NLCD) for the U.S. – the most comprehensive land cover database that the USGS has ever produced. The NLCD 2016 documents land cover change in the Lower 48 states from 2001 to 2016. During this 15-year period, 7.6 percent of the conterminous U.S. changed land cover at least once.
“By far the greatest change across the U.S. since 2001 has been in forest lands — comprising about half of all land cover change,” said USGS NLCD program manager Collin Homer. “Forest harvest and regrowth in the Southeast, and fire, pests and harvest in the West are the causes.”
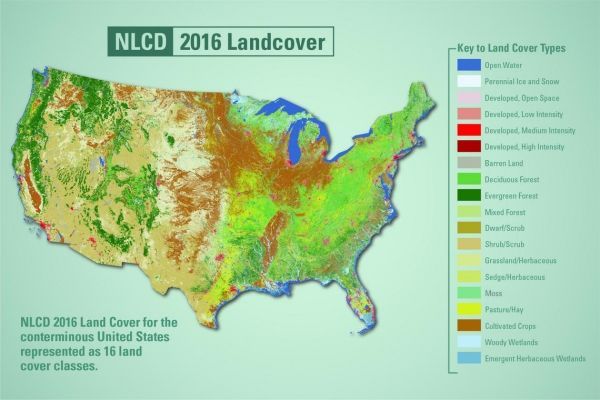
Land Cover for the Conterminous U.S. Shown as 16 Thematic Classes
The database includes seven maps that portray the nation’s land cover and class change for 2001, 2004, 2006, 2008, 2011, 2013 and 2016. The maps sort each 30-meter plot of land across the country into 16 thematic classes such as pasture/hay, deciduous forest or cultivated crops. The NLCD 2016 also characterizes the fractional proportion of urban imperviousness and tree canopy, and for the first time, shrub, bare ground and grassland areas in the Western U.S.
“Examples of other changing land cover categories from 2001 to 2016 include shrub loss in the West mostly from fire, cultivated crop expansion into grasslands in the northern prairies, and urban expansion across the U.S.,” said Homer.
Continue reading at USGS.
Image via USGS.


