
After Barry made landfall as a Category 1 hurricane, NASA’s GPM core satellite analyzed the rate in which rain was falling throughout the storm.
After Barry made landfall as a Category 1 hurricane, NASA’s GPM core satellite analyzed the rate in which rain was falling throughout the storm. Now that Barry is a post-tropical cyclone moving through the mid-Mississippi Valley and toward the Ohio Valley, it is bringing some of that rainfall with it.
NASA Analyzes Barry’s Rain Rates
GPM core satellite passed over Barry and analyzed its rainfall rates several hours after it had made landfall on the coast of Louisiana. Instantaneous surface rain rates were derived from the Dual-polarization Radar onboard the GPM core satellite on July 14 at 02:42 UTC (July 13 at 10:42 p.m. EDT). The GPM data revealed heavy rain bands wrapping up around the eastern side of the storm’s center from the Gulf of Mexico and into central Louisiana and Mississippi. Rainfall rates in those areas were greater than 10 mm/hour (0.4 inches per hour). Some of the storm’s asymmetry was also revealed by the fact that the rain shield is much heavier and broader south of the center of circulation.
At the time of this image, the center of Barry was located about 35 miles southwest of Alexandria, Louisiana and had maximum sustained winds of 50 mph. The following day, July 14, Barry continued its northward trek into northwestern Louisiana and weakened to a tropical depression before it continued into Arkansas. Despite numerous power outages and localized flooding, there were no reports of fatalities or serious injuries due to Barry.
Read more at NASA/Goddard Space Flight Center
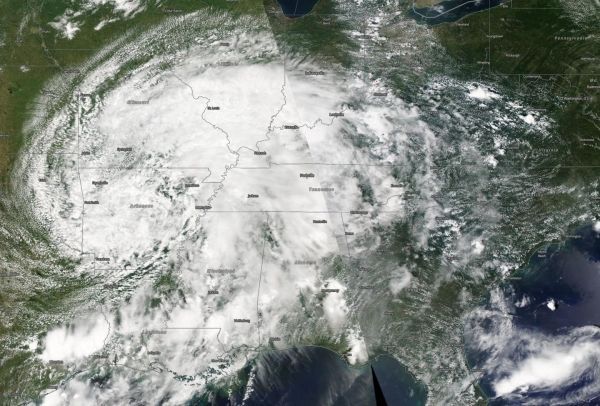
Image: NASA's Aqua satellite captured this visible image of post-tropical cyclone Barry on July 15, 2019 as it was moving through the Mississippi Valley. (Credit: NASA Worldview)


