
Something odd happened in the oceans in the early 20th century.
Something odd happened in the oceans in the early 20th century. The North Atlantic and Northeast Pacific appeared to warm twice as much as the global average while the Northwest Pacific cooled over several decades.
Atmospheric and oceanic models have had trouble accounting for these differences in temperature changes, leading to a mystery in climate science: why did the oceans warm and cool at such different rates in the early 20th century?
Now, research from Harvard University and the UK’s National Oceanography Centre points to an answer both as mundane as a decimal point truncation and as complicated as global politics. Part history, part climate science, this research corrects decades of data and suggests that ocean warming occurred in a much more homogenous way.
The research is published in Nature.
Humans have been measuring and recording the sea surface temperature for centuries. Sea surface temperatures helped sailors verify their course, find their bearings, and predict stormy weather.
Read more at: Harvard John A. Paulson School of Engineering and Applied Sciences
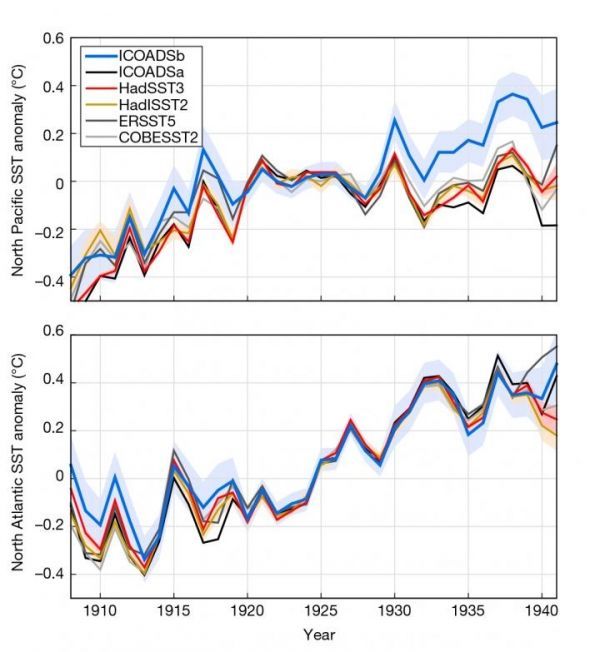
This chart shows annual sea surface temperature changes from different datasets in the North Pacific (top) and North Atlantic (bottom). The blue line indicates the corrected data from this research. It shows greater warming in the North Pacific and less warming in the North Atlantic relative to previous estimates. (Photo Credit: Duo Chan/Harvard)


