
On July 30 at 5:41 a.m. EDT (0941 UTC) infrared data and cloud top temperatures were obtained in then Tropical Storm Flossie, using the Atmospheric Infrared Sounder or AIRS instrument.
On July 30 at 5:41 a.m. EDT (0941 UTC) infrared data and cloud top temperatures were obtained in then Tropical Storm Flossie, using the Atmospheric Infrared Sounder or AIRS instrument. AIRS found coldest cloud top temperatures as cold as or colder than minus 63 degrees Fahrenheit (minus 53 degrees Celsius) around the center of circulation and in a large area west of the center. The stronger the storms, the higher they extend into the troposphere, and they have the colder cloud temperatures.
Flossie continued to strengthen after Aqua passed overhead, and by 5 p.m. EDT (11 a.m. HST/2100 UTC) on July 30, it became a hurricane.
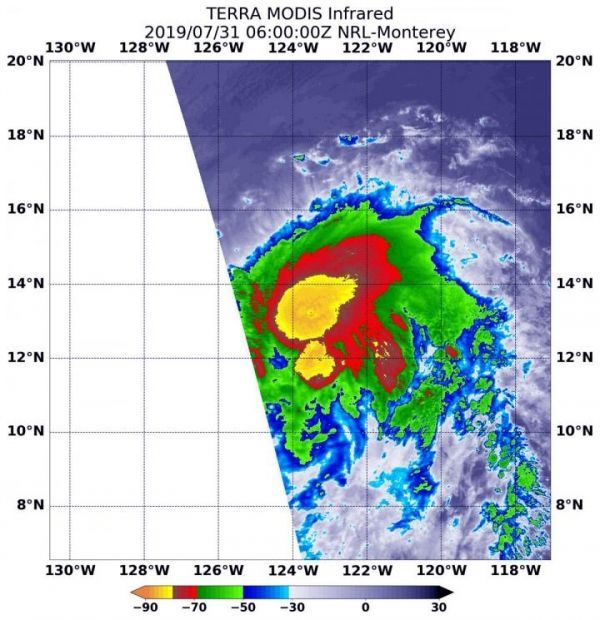
On July 31 at 6:35 a.m. EDT (1035 UTC),the Moderate Imaging Spectroradiometer or MODIS instrument that flies aboard NASA’s Terra satellite gathered infrared data on Flossie after it became a hurricane. Like the AIRS image the previous day, there were two areas of strongest storms. In the Terra imagery, the strongest storms were also colder and clouds tops higher in the troposphere than they were in the July 30 AIRS imagery.
Read more at: NASA/Goddard Space Flight Center
On July 31, 2019 at 6:35 a.m. EDT (1035 UTC), the MODIS instrument that flies aboard NASA's Terra satellite showed strongest storms in Hurricane Flossie were around the center and south of the center where cloud top temperatures were as cold as minus 80 degrees Fahrenheit (minus 62.2 Celsius). (Photo Credit: NASA/NRL)


