
A new video from NASA provides a glimpse of global wildfire trends over the past two decades, showing where fires have intensified due to agricultural practices, including in Africa and Southeast Asia, and climate change.
A new video from NASA provides a glimpse of global wildfire trends over the past two decades, showing where fires have intensified due to agricultural practices, including in Africa and Southeast Asia, and climate change.
The 30-second clip uses satellite data to map fires burning on a monthly basis from 2000 to 2019. As NASA explains, the colors in the video are based on the number — not size — of fires observed within a 1,000-square-kilometer area per day. Areas of white indicate more fires, as high as 30 per day, while orange indicates as many as 10 fires and red as few as 1 fire per day.
The data shows clear seasonal trends, with lightning-triggered fires in North America and Eurasia during summer months, as well as fires set to clear land for agriculture during the dry season in August, September, and October in South America, Asia, and Africa. It also shows longer-term trends, including the rapid expansion of agriculture into tropical forests in Central Africa and Indonesia over the past two decades, and an increase in the severity of fires in the Northern Hemisphere due to climate change.
But as NASA noted, “Africa is truly the fire continent.” On an average day in August, satellites typically detect 10,000 actively burning fires around the world — 70 percent of which are in Africa.
Read more at Yale Environment 360
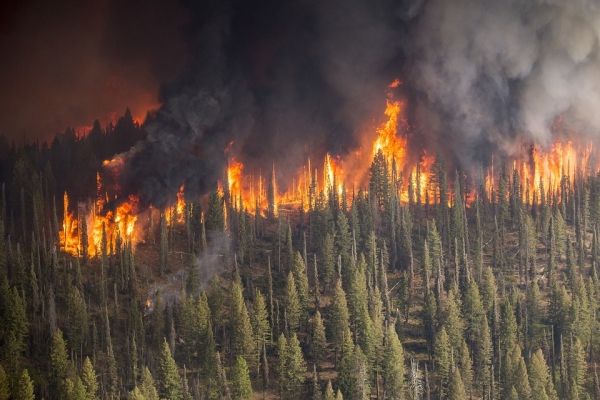
Photo Credit: skeeze via Pixabay


