
On Monday morning, September 9, Hurricane Dorian was a post-tropical storm after a mid-latitude weather front and cold seas had altered its tropical characteristics over the weekend.
On Monday morning, September 9, Hurricane Dorian was a post-tropical storm after a mid-latitude weather front and cold seas had altered its tropical characteristics over the weekend. NASA compiled data on Hurricane Dorian and created a map that showed the heavy rainfall totals it left in its wake from the Bahamas to Canada.
On Saturday and Sunday, Sept. 7 and 8, Hurricane Dorian struck eastern Canada, causing wind damage and bringing heavy rainfall. According to the Associated Press, a peak of 400,000 people were without power in Nova Scotia, Canada, because of Dorian.
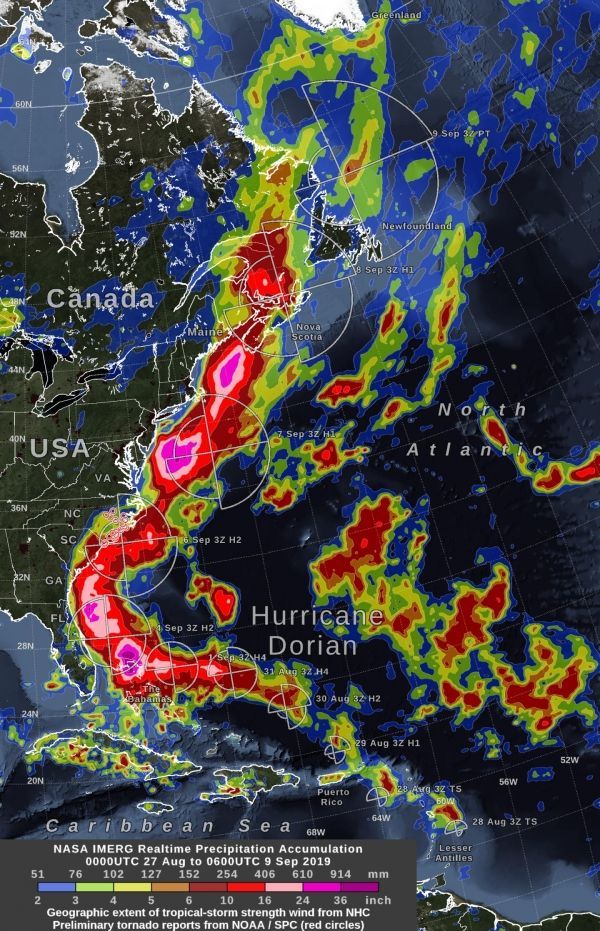
At NASA’s Goddard Space Flight Center in Greenbelt, Maryland, a graphic was produced that shows precipitation that fell during the almost two-week period from August 27 to the early hours of Sept. 9. The near-real-time rain estimates come from the NASA’s IMERG algorithm, which combines observations from a fleet of satellites, in near real time, to provide near-global estimates of precipitation every 30 minutes.
This year, NASA began running an improved version of the IMERG algorithm that does a better job estimating precipitation at high latitudes, specifically north of 60 degrees North latitude. The post-tropical remnants of Hurricane Dorian were approaching this cold region at the end of the analysis period. While the IMERG algorithm is still unable to estimate precipitation falling over ice-covered surfaces (such as Greenland), IMERG can now give a more complete picture of the water cycle in places such as Canada, which is, for the most part, free of snow cover at this time of year.
Read more at NASA/Goddard Space Flight Center
Image: At one-day intervals, the image shows the distance that tropical-storm force (39 mph) winds extended from Hurricane Dorian's low-pressure center, as estimated by the National Hurricane Center. The Saffir-Simpson hurricane-intensity category is the number following the "H" in the label on the image. "TS" or "PT" indicate times when the storm was either at tropical storm strength or when the storm was categorized as post-tropical. Red circles over North Carolina indicate preliminary reports of tornadoes on Sept. 5. (Credit: NASA Goddard)


