
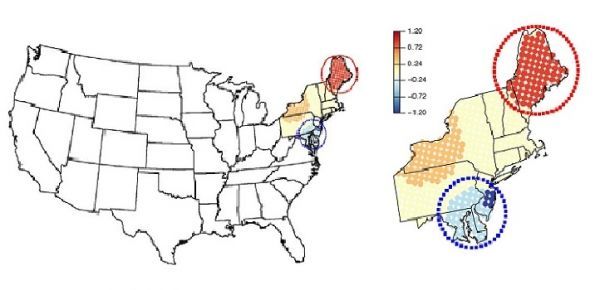
More accurate detection of hotspot clusters provides new insights into the behavior of air pollution.
A more reliable method for identifying regions with different relationships between air pollution and weather conditions improves the detection of pollution hotspots.
The relationship between weather conditions and air pollution is complex and can vary wildly from location to location. This makes it difficult to pinpoint the sources of pollution and predict its behavior in the atmosphere. While data scientists and statisticians have made significant progress in wrestling with this problem, the enormous volumes of environmental data and multitude of variables, such as wind speed, temperature and pollution component, require compromises to make the problem manageable.
For example, most existing approaches to detecting "hotspots" in the correlation between variables in spatial data involve constructing a grid in which the relationship between variables in a cell is treated independently of all others. Although this is not entirely realistic—there is often dependence between spatial areas particularly in weather and air pollution data—it is extraordinarily difficult to find spatial hotspots and determine the spatial dependence structure at the same time.
Ying Sun and Junho Lee from KAUST’s Environmental Statistics Laboratory have made a leap forward in addressing this problem with the development of a "mixed effect model" for hotspot detection.
Continue reading at King Abdullah University of Science and Technology
Image via King Abdullah University of Science and Technology


