
NASA-NOAA’s Suomi NPP satellite and NASA’s Aqua satellite both passed over the Northwestern Pacific Ocean and both used infrared light to obtain temperature data and shape information on Typhoon Bualoi.
NASA-NOAA’s Suomi NPP satellite and NASA’s Aqua satellite both passed over the Northwestern Pacific Ocean and both used infrared light to obtain temperature data and shape information on Typhoon Bualoi.
The shape of a storm says a lot about what is happening to it. Symmetrical storms are stronger, more organized storms. It is like a spinning tire that is well rounded. It can spin faster. Asymmetric storms cannot rotate as fast as symmetrical storms. It is similar to a flat tire cannot go as fast as a rounded tire. Satellite data provides a look at the symmetry of storms and found that Typhoon Bualoi is now an asymmetric storm, indicating it is weakening.
Infrared data provides temperature information, and the strongest thunderstorms that reach high into the atmosphere have the coldest cloud top temperatures. This data is helpful to forecasters because storms are not uniform around tropical cyclones and it helps pinpoint where the strongest storms are located.
Read more at NASA / Goddard Space Flight Center
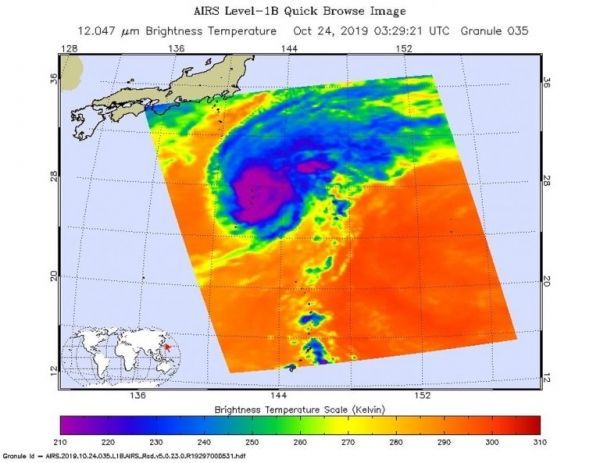
Image: NASA’s Aqua satellite passed over Typhoon Bualoi and the AIRS instrument aboard captured this image of the storm on Oct. 23 at 11:29 p.m. EDT (0329 UTC). Aqua found that the strongest thunderstorms around west of center had cloud top temperatures as cold as or colder than 210 Kelvin (minus 81.6 degrees Fahrenheit/minus 63.5 Celsius). Credit: NASA JPL, Heidar Thrastarson


