
Typhoon Halong continued to strengthen in the Northwestern Pacific Ocean as NASA’s Terra satellite passed overhead.
Typhoon Halong continued to strengthen in the Northwestern Pacific Ocean as NASA’s Terra satellite passed overhead. Infrared imagery from an instrument aboard Terra revealed very high, powerful storms with very cold cloud top temperatures circling the center as well as in a band of thunderstorms west of the center.
Halong developed on Nov. 2 from a low-pressure area designated as System 99W. The storm consolidated into a tropical storm later that day. On Nov. 3, Halong intensified further and became a typhoon.
Tropical cyclones are made of up hundreds of thunderstorms, and infrared data can show where the strongest storms are located. They can do that because infrared data provides temperature information, and the strongest thunderstorms that reach highest into the atmosphere have the coldest cloud top temperatures.
Read more at NASA / Goddard Space Flight Center
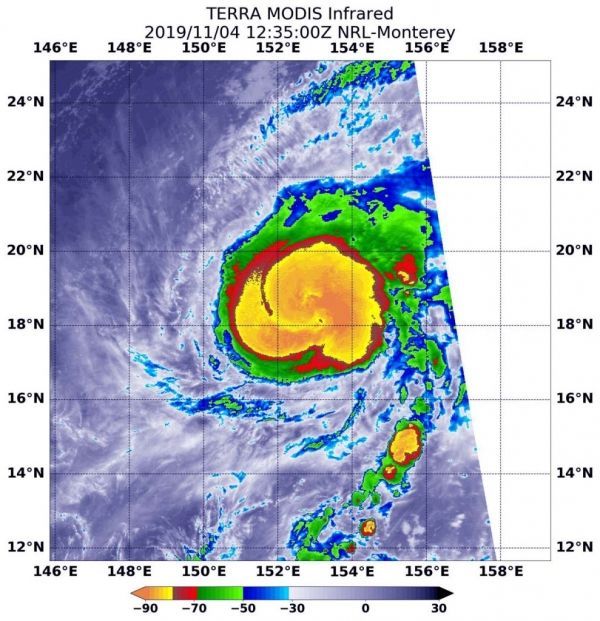
Image: On Nov. 4 at 7:35 a.m. EDT (1235 UTC) the MODIS instrument that flies aboard NASA’s Terra satellite showed areas around Halong’s center as well as in a band of thunderstorms west of the center (in yellow), where cloud top temperatures were as cold as or colder than minus 80 degrees Fahrenheit (minus 62.2 Celsius). Credit: NASA/NRL


