
Following an exceptionally wet January, an atmospheric river carried even more moisture into the region in February.
January 2020 in the Pacific Northwest was exceptionally wet. Seattle, for example, received a measurable amount of rainfall almost every day of the month. Wet conditions continued through the first week of February, when a stream of water vapor from the tropical Pacific moved even more moisture into the region.
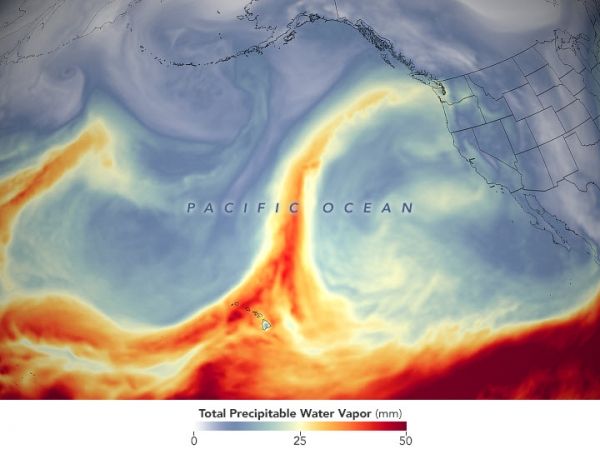
This map shows the total precipitable water vapor in the atmosphere at 1 a.m. Pacific Standard Time on February 6, 2020. The image was derived from a NASA model known as the Goddard Earth Observing System Data Assimilation System (GEOS DAS), which uses satellite data and mathematical representations of physical processes to calculate what is happening in the atmosphere.
Total precipitable water vapor is the depth of water in a column of the atmosphere if all the water vapor in that column were condensed into liquid. In this image, red areas represent the highest values of precipitable water vapor, which showed up that day as a narrow feature known as an atmospheric river. The precipitation from atmospheric rivers accounts for up to 50 percent of all rain and snow that falls in the western United States. They are also responsible for almost all of the major flood events on river systems in western watersheds.
Continue reading at NASA Earth Observatory
Image via NASA Earth Observatory


