
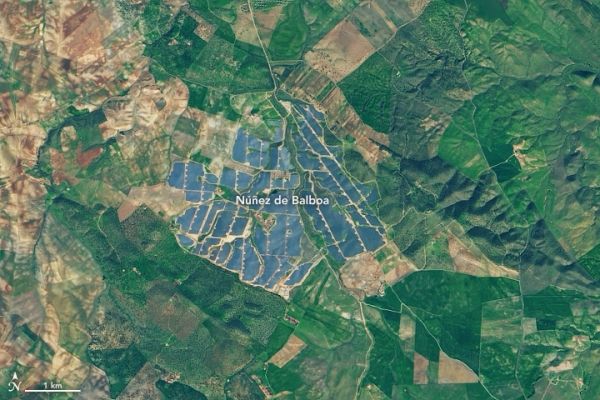
The 500-megawatt Núñez de Balboa photovoltaic plant in Spain will supply energy to 250,000 people per year.
It is not every day that a textbook high-pressure system, cold front, and warm front all reveal themselves on the same natural-color satellite image. But that is exactly what NASA research meteorologist Galina Wind recently noticed over the Eastern United States as she was browsing old satellite imagery.
The image above is a mosaic based on data collected by the Moderate Resolution Imaging Spectroradiometer (MODIS) on NASA’s Aqua satellite and the Visible Infrared Imaging Radiometer Suite (VIIRS) on Suomi NPP on September 12, 2019. In the Southeast, thin rows of cumulus clouds trace the location of the high, with the center of circulation near Mississippi. High pressure systems typically have cool, descending air flow in their centers and winds that move in a clockwise direction in the Northern Hemisphere.
On weather maps, the center of a high is generally marked with a blue H. “But in natural-color satellite images, you usually see clear skies because the downward movement of the air is strong enough to prevent any convective clouds from rising up as the Sun heats the surface,” explained Wind. “In this case, the descending air was weak enough that some fair-weather cumulus clouds were able to bubble up anyway.”
The cold front, marked with blue triangles on a weather map, is visible here as a curving line of clouds with intense convection running through Minnesota, Iowa, Missouri, Kansas, and Oklahoma. While highs generally lead to sunny, calm conditions, cold fronts often produce turbulent, unsettled skies.
Continue reading at NASA Earth Observatory
Image via NASA Earth Observatory


