
Researchers using vegetation data to explain moose population dynamics run into a hidden variable and a possible signature of history.
A team of researchers from the U.S., Europe, and Russia set out to use satellite data and computer models to figure out where moose live in Russia and why they should be more and less abundant in different regions. In theory, more abundant and seasonally consistent vegetation (food) should mean more moose, but they wanted to know whether vegetation health was the best predictor. Such models can be useful for managing animal species and conserving forests and other lands.
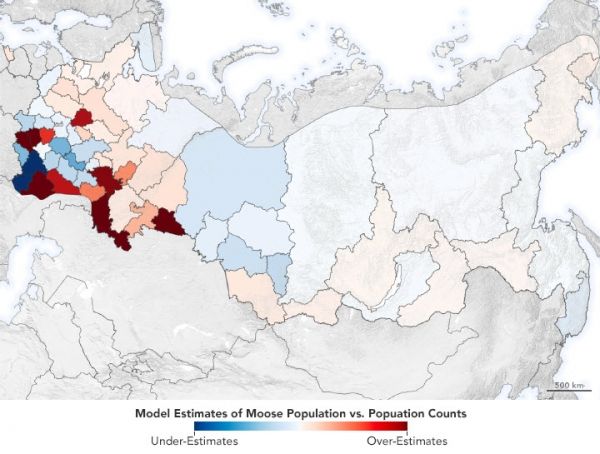
The model worked quite well for the early years that the researchers studied. But then something happened: the model was predicting more moose in some areas than the real world delivered. What was happening on the ground that the researchers could not see?
For several years, scientists from the University of Wisconsin-Madison have been developing global Dynamic Habitat Indices (DHIs)—analytical tools to describe the productivity of plants and trees on a landscape and how that influences the biodiversity of animals. The first DHI, cumulative vegetative productivity, measures how prolific and healthy vegetation is across a period of time. Minimum vegetative productivity describes the lowest productivity level. And seasonal vegetative productivity describes how much or little that plant abundance varies with the seasons. The three indices are derived from data collected by the Moderate Resolution Imaging Spectroradiometer (MODIS) instruments on NASA's Terra and Aqua satellites.
Continue reading at NASA Earth Observatory
Image via NASA Earth Observatory


