
Satellite data of Tropical Cyclone Nisarga’s cloud top temperatures revealed that the storm had strengthened before it began making landfall in west central India.
Satellite data of Tropical Cyclone Nisarga’s cloud top temperatures revealed that the storm had strengthened before it began making landfall in west central India.
Nisarga formed around 5 p.m. EDT (2100 UTC) on June 2, and had maximum sustained winds near 40 knots (46 mph/74 kph) at that time. Within 12 hours, the storm intensified to hurricane strength.
One of the ways NASA researches tropical cyclones is using infrared data that provides temperature information. Cloud top temperatures provide information to forecasters about where the strongest storms are located within a tropical cyclone (which are made of hundreds of thunderstorms). Tropical cyclones do not always have uniform strength, and some sides are stronger than others. The stronger the storms, the higher they extend into the troposphere, and the colder the cloud temperatures.
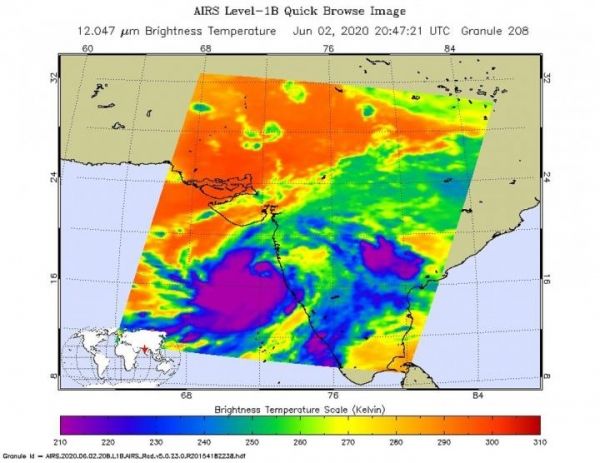
On June 2 at 4:47 p.m. EDT (2047 UTC) NASA’s Aqua satellite analyzed the storm using the Atmospheric Infrared Sounder or AIRS instrument. AIRS found cloud top temperatures were getting colder. Colder cloud tops are an indication that the uplift of air in the storm was getting stronger and thunderstorms were building higher into the troposphere. AIRS found temperatures as cold as or colder than minus 63 degrees Fahrenheit (minus 53 degrees Celsius) around the center. NASA research has shown that cloud top temperatures that cold indicate strong storms that have the capability to create heavy rain.
Read more at NASA/Goddard Space Flight Center
Image: On June 2 at 4:47 p.m. EDT (2047 UTC) NASA's Aqua satellite analyzed Tropical Cyclone Nisarga using the Atmospheric Infrared Sounder or AIRS instrument. AIRS found coldest cloud top temperatures as cold as or colder than (purple) minus 63 degrees Fahrenheit (minus 53 degrees Celsius) around the storm's center. (Credit: NASA JPL/Heidar Thrastarson)


