
When NASA’s Aqua satellite passed over Tropical Storm Cristina in the Eastern Pacific Ocean on July 8, it gathered water vapor data that provided information about the intensity of the storm
When NASA’s Aqua satellite passed over Tropical Storm Cristina in the Eastern Pacific Ocean on July 8, it gathered water vapor data that provided information about the intensity of the storm.
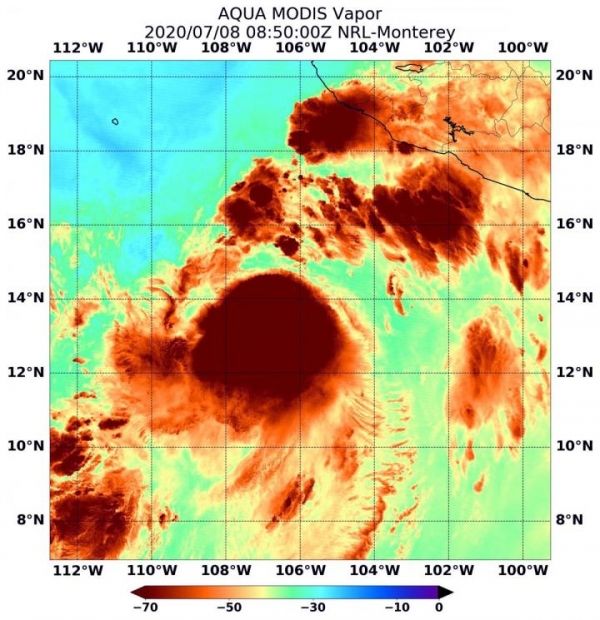
NASA’s Aqua satellite passed over Christina at 4:50 a.m. EDT (0850 UTC) and the Moderate Resolution Imaging Spectroradiometer or MODIS instrument gathered water vapor content and temperature information. The MODIS image showed highest concentrations of water vapor and coldest cloud top temperatures were around the center of circulation. MODIS data also showed coldest cloud top temperatures were as cold as or colder than minus 70 degrees Fahrenheit (minus 56.6 degrees Celsius) in those storms. Storms with cloud top temperatures that cold have the capability to produce heavy rainfall.
Water vapor analysis of tropical cyclones tells forecasters how much potential a storm has to develop. Water vapor releases latent heat as it condenses into liquid. That liquid becomes clouds and thunderstorms that make up a tropical cyclone. Temperature is important when trying to understand how strong storms can be. The higher the cloud tops, the colder and the stronger the storms.
Read more at: NASA/Goddard Space Flight Center
On July 8 at 4:50 a.m. EDT (0850 UTC) NASA's Aqua satellite passed over Tropical Cyclone Cristina, located in the Eastern Pacific Ocean. Aqua found highest concentrations of water vapor (brown) and coldest cloud top temperatures were around the center. (Photo Credit: NASA/NRL


