
NASA used satellite data to create an animation of Fay’s development and progression over the past few days, showing how the storm organized into a tropical storm.
NASA used satellite data to create an animation of Fay’s development and progression over the past few days, showing how the storm organized into a tropical storm. Additionally, NASA’s Aqua satellite used infrared light to find the location of the strongest storms in Tropical Storm Fay occurring in the northeastern quadrant of the storm, mostly over the Atlantic Ocean.
Tropical Storm Fay was officially named as the sixth tropical storm the Atlantic Ocean Hurricane Season by 5 p.m. EDT on July 9. The storm formed just off the North Carolina coast. For several days before that, forecasters were using satellite data to track the storm as it developed.
Previously designated as System 98L, the low-pressure area formed off the Georgia coast and moved north. At NASA’s Goddard Space Flight Center in Greenbelt, Md. NASA Worldview was used to create an animation of visible imagery of the storm using data from NASA-NOAA Suomi NPP satellite. The animation showed the development and progression of System 98L into Tropical Storm Fay from July 6 to July 9.
Read more at: NASA/Goddard Space Flight Center
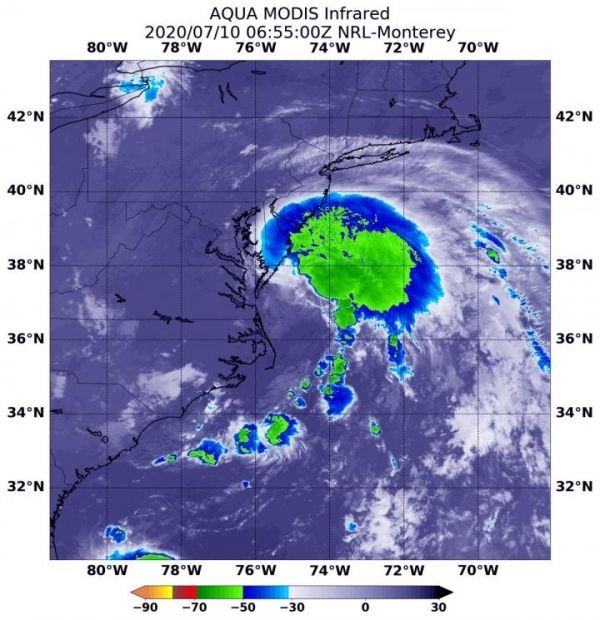
On July 10 at 2:55 a.m. EDT (0655 UTC), the MODIS instrument aboard NASA's Aqua satellite gathered temperature information about Tropical Storm Fay's cloud tops. MODIS found powerful thunderstorms where temperatures were as cold as or colder than minus 63 degrees Fahrenheit (minus 53 Celsius) mostly over the western Atlantic Ocean and over parts of coastal Delaware and southern New Jersey. (Photo Credit: NASA/NRL


