
The pandemic has tugged carbon emissions down, temporarily. But levels of the powerful heat-trapping gas methane continue to climb, dragging the world further away from a path that skirts the worst effects of global warming.
The pandemic has tugged carbon emissions down, temporarily. But levels of the powerful heat-trapping gas methane continue to climb, dragging the world further away from a path that skirts the worst effects of global warming.
Global emissions of methane have reached the highest levels on record. Increases are being driven primarily by growth of emissions from coal mining, oil and natural gas production, cattle and sheep ranching, and landfills.
Between 2000 and 2017, levels of the potent greenhouse gas barreled up toward pathways that climate models suggest will lead to 3-4 degrees Celsius of warming before the end of this century. This is a dangerous temperature threshold at which scientists warn that natural disasters, including wildfires, droughts and floods, and social disruptions such as famines and mass migrations become almost commonplace. The findings are outlined in two papers published July 14 in Earth System Science Data and Environmental Research Letters by researchers with the Global Carbon Project, an initiative led by Stanford University scientist Rob Jackson.
In 2017, the last year when complete global methane data are available, Earth’s atmosphere absorbed nearly 600 million tons of the colorless, odorless gas that is 28 times more powerful than carbon dioxide at trapping heat over a 100-year span. More than half of all methane emissions now come from human activities. Annual methane emissions are up 9 percent, or 50 million tons per year, from the early 2000s, when methane concentrations in the atmosphere were relatively stable.
Read more at Stanford's School of Earth, Energy & Environmental Sciences
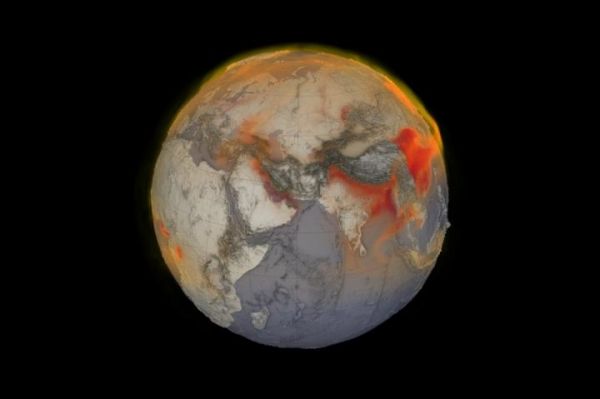
Image: A visualization of global methane on January 26, 2018. Red shows areas with higher concentrations of methane in the atmosphere. (Credit: Cindy Starr, Kel Elkins, Greg Shirah and Trent L. Schindler, NASA Scientific Visualization Studio)


